Quick Tour of Signal Chain Explorer
SCE Quick Tour
When the first preview of Signal Chain Explorer (SCE) was released, we included a PDF “quick tour” document with the product, which is also available for download on this site. However, as the product has evolved, that document is now a little bit out of date. We’ve decided to update the quick tour in the form of a blog post, so that you won’t have to download anything, and we can flesh out the documentation as times goes by.
SCE in a Nutshell
So what is SCE for? It’s there to help you explore analog signal chains and determine where problems may be lurking in those signal chains. We call those problems gargoyles and we’ll talk about them in a bit. SCE works by representing a signal chain as a series of sub-circuits called stages. Linear frequency domain analysis is used to model those circuits and associated external interferences, and signal quality is determined in the presence of gargoyles.
SCE is not a general purpose circuit simulator. Instead, we provide a library of pre-built, canned stages, but with enough flexibility to let you model the core of many signal chain designs. You can mix and match these stages to build any number of varying designs. By using canned stages, the program can do its work very quickly and accurately — its internal modeling is fast and efficient and numerically stable and precise. For single-ended signal chains (ie. grounded as opposed to differential), no iterative equation-solving is needed under the hood. Differential signaling uses a minimum amount of equation solving.
More importantly, SCE allows you to do your work quickly as well: Constructing a signal chain is easy. Just a few clicks here and there and boom! There’s your design. Built-in equation worksheets and data entry GUI elements make it easy to enter and compute parameters. We also have a pre-built common interference model database that you can turn on with a click or two. No laborious net lists or models to concoct as you would have to do in Spice and other simulation tools.
What is a Signal Chain?

A signal chain is that part of your embedded system that comprises the main path of your signal, from input sensor to output A/D. Included in this chain are things like a sensor, various filters, gain stages, and an A/D converter (ADC) — the sub-circuits you use to condition your signal for proper digitization. Not included in the signal chain are all the ancillary bits of circuitry that help support the signal path — things like power supply regulation, protection circuitry, control switches, and the like. (We do help you model local power isolation for your stages, but not the details of the power bus itself.)
Why the name Gargoyle?
The name gargoyle is historically associated with the decorative water spouts on the sides of early medieval churches that often came in the form of grotesque creatures carved as stone figures. Some say these creatures, these gargoyles, were placed to ward off evil spirits. Others say the creatures were there to remind the lay people that evil lurks everywhere, and to be wary.
It’s in the latter spirit that we use the term gargoyle. In SCE, gargoyles are those elements lurking in your circuit that can wreak havoc, causing loss in signal quality and unwanted oscillations. Examples include capacitive loads on op-amps that cause peaking, parasitics in trace wiring or cables, thermal noise, thermal distortion, and last but not least, interference from stray H-fields and E-fields that distort your signal. An example of the latter might be the interference caused by placing a microprocessor clock signal too close to your main signal line.
One of the major reasons SCE was developed is to help you track down and capture gargoyles — those demons lurking, ready to pounce on the unwary circuit designer. SCE is a member of an envisioned family of products that help you design robust circuits.
The Main Screen
Below is a screen shot of the main window of SCE from a recent build the preview release.
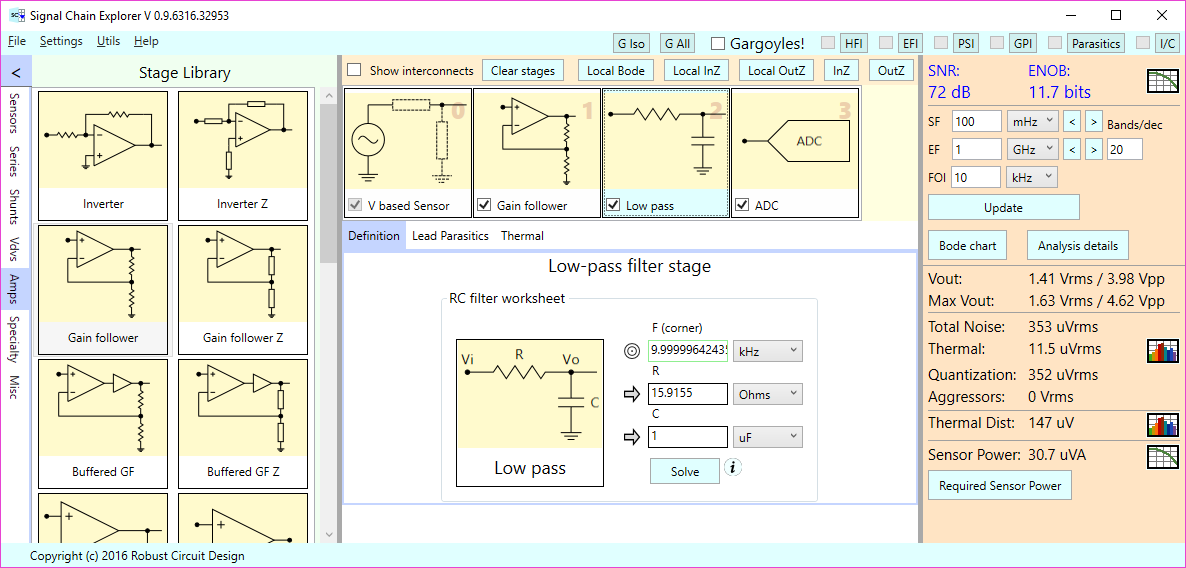
Let’s walk through each of the main panels:
- The upper left corner houses the main menu, where you can do things like create a new signal chain, change master settings, run pop-up utilities, and to get help for the program or enter licensing information.
- The left panel houses the stage library, where you can select from various types of stages, such as sensors, series and shunt branches, voltage dividers, amplifier stages, filters, multiplexors, and A/D converters.
- The upper portion of the central panel shows a view of the current signal chain. The chain is partitioned into a series of stages, each stage serving as a functional portion of the circuitry. In our screen shot above, there are four stages shown: A generic voltage-based sensor, an inverting amplifier stage, a passive low-pass filter, and finally an A/D converter. A key feature of SCE is that you can turn the individual stages on and off using the check boxes in the lower left corner of each stage. When a stage is checked off, it’s like the stage isn’t there. This ability to temporarily remove a stage from consideration is invaluable when exploring different design tradeoffs, or when hunting down the location of a lurking gargoyle.
- The main portion of the center panel is where the stage parameters of the currently selected stage are defined and set. In the screen shot above, a low pass filter stage is selected. It has three main parameters: (1) The corner frequency F, the resistance R, and the capacitance C. To the left of each field is an icon — either an arrow or target. Taken as a set, the fields comprise what is called an equation worksheet. In this case the equation is 2 Pi F R C = 1 which relates F to R and C. The fields with arrows serve as independent variables that are used to compute the third variable — the one with the target. Here, the frequency F is the target, so that means F is solved in terms of R and C, using the equation given earlier. Equation worksheets form an integral and unique part of SCE that will be explained in depth later.
- The upper right corner is comprised of various toggles and buttons that are another key feature of SCE, the Gargoyle buttons. These are used to turn the various types of gargoyles and on and off. As you explore the design space of your signal chain, you’ll find yourself using the Gargoyle buttons quite often.
- The right panel is where the main analysis is run and where the main results are shown. There are two key numbers on the right: The effective number of bits ENOB, and the Signal-to-Noise-Ratio SNR. Determining these numbers is the main goal of SCE — getting as much effective resolution as possible for you signal, and correspondingly, with the least amount of noise.
- The center portion of the right panel is where you define the frequency range for which to run the analysis. You give starting and ending frequency, and specify the simulation resolution in terms of frequency bands per decade. Another key parameter is the user-selected Frequency of Interest (FOI). Many of the results are couched in terms of this frequency. Also on this panel are the Update, Bode chart, and Analysis Details buttons used to run the analysis and call-up the results in chart and text form.
- The lower portion of the right panel gives a summary of the voltage signal output (at the frequency of interest, as well as the overall noise voltage due to gargoyles — which include thermal noise, quantization noise, and external interference noise affecting the circuit. The latter we alternatively call aggressor noise. Aggressors are gargoyles present in the power bus, the ground plane, and the interconnect wiring, all which can wreak havoc on your signal.
- The bottom portion of the right panel shows two main results: (1) How much thermal distortion is present — basically transient voltage wiggles caused by the different components of your circuit heating and and cooling differently, and (2) the Required Sensor Power. This is a unique feature of SCE that lets you see how the desired signal quality (in terms of ENOB and SNR) relates to the voltage, current, and power required from the sensor. With this feature, you can see if your desired signal quality goals are even feasible.
The Signal Chain Panel

Let’s delve a little deeper into the Signal Chain Panel stage list, which appears near the top of the main screen. This panel contains a horizontally scrollable list of stage icons. The currently selected stage is highlighted with a cyan/turquoise title. In the example above, the low pass filter stages is highlighted.
An important feature of SCE is the ability to turn stages on and off. The checkbox at the lower left of each stage serves this purpose. When a stage is turned off, SCE pretends it’s not there, and the stages before and after the turned-off stage are connected together directly. Being able to turn a stage on and off quickly helps you narrow down what’s causing a particular behavior under investigation. It’s a way of easily toggling before/after behavior.
Just above the stage list is the Show interconnects check box:
![]()
When Show interconnects is checked, space opens up between each stage in order to show details about the wiring between the stages. Here’s an example with the interconnections expanded:

The text labels between each stage — which also serves as buttons — indicate the type of connection between the indicated stages. There are four types of connections:
- TRC — Traces (PCB or silicon based)
- TWL — Twin lead wiring
- TWP — Twisted pair wiring
- COAX — Coax cable
In this example, the connections are all traces, as indicated by the TRC labels. Clicking on one of these labels causes the Interconnect Wiring Model panel for the selected interconnect to appear below the stage list. For example:
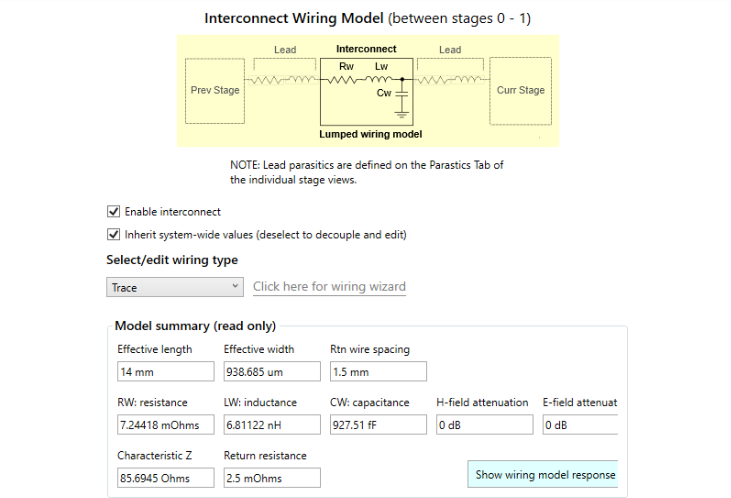
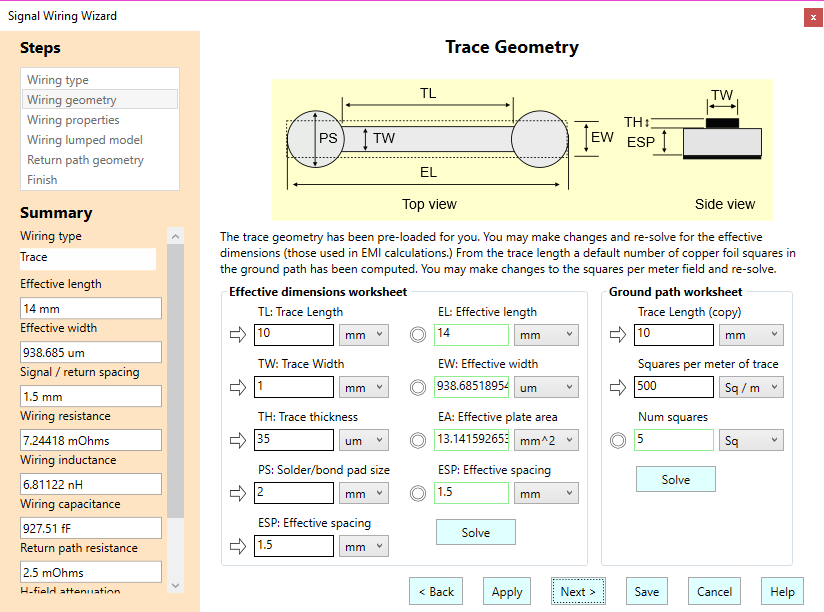
The connection model includes lead parasitics and a lumped-model of the wiring itself, be it trace or cable wiring. If you click on the Click here for wiring wizard link, you’ll get a popup dialog wizard that takes you through the steps of defining the wiring type, geometry, and electrical properties. (NOTE: You’ll have to turn off the Inherit system-wide values check box in order to do the editing.) Here’s a example of one of the screens of the wiring wizard which shows the Trace Geometry page:
Stage Library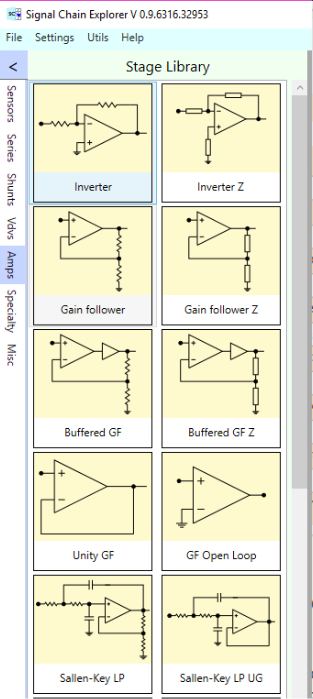
The left panel of the main window contains a library of all the possible stages you can incorporate into your signal chain. Located down the left side of the panel are blue vertical tabs used to select from the various category of stages: Sensors, Series Branches, Shunt Branches, Voltage Dividers (VDV’s), Amplifiers and active filters, Specialty stages (such as pie networks, LC Baluns, Transformers), and Miscellaneous stages, such as multiplexors and A/D converters.
To add a stage to the signal chain, first select the stage in the signal chain stage list that’s just before where you’d like to insert the stage, and then select one of the tabs from the stage library, and then scroll through the list to find the stage you are looking for. Double-clicking on a stage icon causes a stage of that type to be inserted into the signal chain.
NOTE: New stages are always inserted to the right of the currently selected stage in the signal chain. You can change the order of the stages by right-mouse-clicking on the stage icons. A context menu pops up allowing you to move the currently selected stage left or right. This is also the menu to use if you wish to remove a stage from the signal chain.
Setting Stage Parameters
Each stage comes with a set of defaulted parameters. To change those defaults, first select the stage by clicking on it in the stage list, the panel below the stage list will get populated with the details for that stage. Here’s an example for an RC low-pass filter stage:
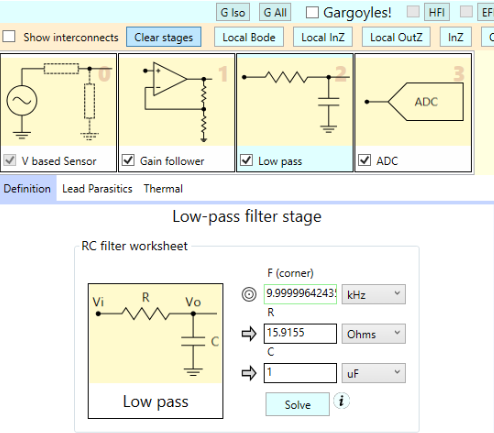
At the top of the stage view are a series of tabs which organize the parameters into groups. The main tab is the first one labeled Definition. Other ones shown in our figure are for defining the parasitics in the incoming and outgoing leads of the stage, and one to define the thermal properties for stage (in the preview this is mainly for resistor and/or amplifier thermal properties).
NOTE: The actual number of tabs varies depending on the type of stage, but most stages have the three tabs just mentioned.
The stage definition for a low-pass filter consists mainly of a GUI construct called an Equation Worksheet containing a series of fields that are related in some way in one or more underlying equations. The idea is that you can set or define most of the fields and then the rest are computed for you. To the left of each field is an icon. The fields with target icons are computed automatically whenever the Solve button is pressed. In terms of equations, the target fields are for the dependent variables of the underlying equations. The arrow fields are for the independent variables. For these fields, you must enter values for them (defaults are almost always given). The field icons are actually button toggles. Toggling and icon changes the behavior of the field between arrow and target semantics.
NOTE: Whether or not you can change a field icon depends on the underlying equation(s) of the worksheet and how that worksheet is designed. Each one is a little different.
In the example above, only one equation is represented — that which relates the R-C values to the corner frequency of the filter. That equation is 2 Pi F R C = 1. So there are three fields, F, R, and C, which are for the corner frequency, resistance, and capacitance, respectively. We’ve made the R and C arrow fields, so they are the ones where you define their values. The F field is then computed whenever the Solve button is clicked.
NOTE: To help you see what equation(s) is (are) being solved, you can click or hover on the Information Icon (circle with the letter i) , and a small popup window will be displayed showing the equations involved.
Most fields of a worksheet contain both units and scaling prefixes, which often use what are called metric prefixes, such as kilo, mega, giga, milli, micro, nano, etc., usually shown with single-letter indicators. You can type a number into the edit box of a field, and then select the scaling prefix by both mouse and keyboard.
In this overview we won’t be going into detail how to use the equation fields, as they can a bit subtle. But note that in practice, these fields are designed to be easy and intuitive to use, and are designed to allow you quickly and easily enter values. We’ll be covering them in detail in a separate blog post.
For now, you can download the following PDF file which shows how to use the equation fields in detail:
Using Unit and Equation Var Fields
The Analysis Panel
The upper panel on the rights side of the main window is where an analysis of the signal chain can be initiated:
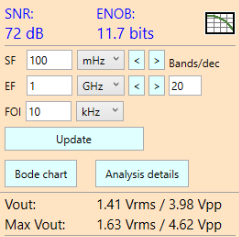
Here, you set the starting (SF) and ending (EF) frequencies of the analysis you’d like to run, as well as select a “frequency of interest” (FOI). You also set the frequency resolution of the analysis in terms of the bands per decade field. This resolution is logarithmic in nature. To initiate a run, you press the Update button. This button is the workhorse of SCE. You’ll be using it often.
NOTE: SCE does most of its analysis in the frequency domain, using a fast and accurate proprietary calculation engine. Time domain analysis is currently not supported, though it’s planned for the future. You can see a preview of this type of analysis in the sister product Signal Wave Explorer (SWE).
After an update has been run, (which is typically instantaneous), the main results are displayed in the Analysis Panel. At the top, in bold and blue, are the two main numbers of interest, ENOB (for effective number of bits) and SNR (for signal-to-noise ratio). These numbers are computed at the specified frequency of interest. Usually the main goal of SCE is to drive these numbers as high as possible while meeting signal gain and frequency requirements.
Two other results are displayed at the bottom of the Analysis Panel: the signal output voltage Vout — at the frequency of interest, and the maximum signal voltage, Max Vout — that occurs in the specified frequency range. These are conveniently presented to you in both RMS and peak-to-peak values. You’ll want to monitor these values to make sure they are within range of any A/D converter you may be using in the signal chain. If the values are out of range of said converter, a yellow triangular warning icon will be displayed (not shown above).
There are two other buttons in the Analysis Panel that you’ll be pressing quite often. The Bode chart button popups a dialog containing the gain and phase curves of the output signal, using the frequency range set in the panel. The Analysis details button pops up a window given a detailed summary of the results, including individual thermal noise contributions of any resistive elements, and a list of interference voltages that can affect signal quality. These are all referred to output.
Here’s the Bode chart produced by SCE, for the signal chain in our example:
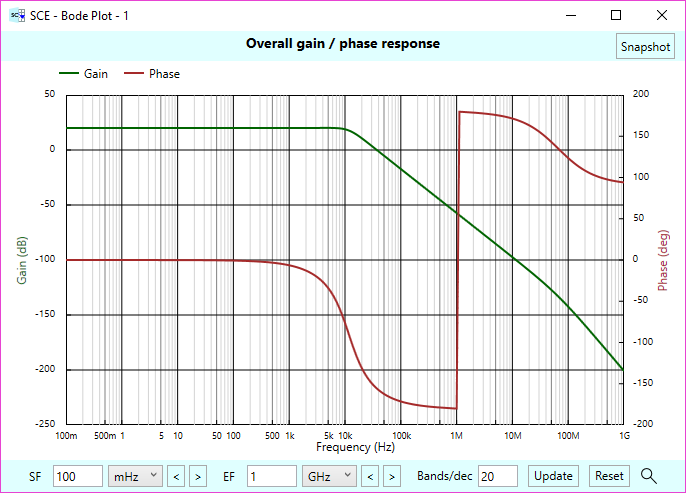
The chart is “live.” You can change the frequency range by entering new frequencies at the bottom of the dialog, or you can use the short-cut frequency “zoom” buttons, which are represented by left and right chevrons which move the bounds of the frequency range in decade multiples. These allow you to zoom into a more detailed frequency range. If the chart appears a bit too choppy you can increase the resolution by setting a new bands/decade value.
Each change of the frequency range or resolution invokes an entirely new analysis to be run when the chart’s Update button is pressed, so as you zoom in, the details will be accurate to within the resolution you’ve set — it’s not just a simple graphics scaling. Because SCE’s computation engine is fairly fast, the new results can be displayed almost instantaneously.
The frequency range selected within a chart is independent of the main analysis that’s run on the main screen. The idea is to allow you to zoom in to see any peaking that might occurring. You may have to set a finer resolution (higher bands/decade) to see such peaking.
At the upper right corner of the chart is a Snapshot button. You can use this to “freeze” the current graph, for comparison with later charts. After a chart is frozen, it’s controls are frozen too. So if you want a new chart, perhaps after making changes to the signal chain, you’ll have to go back to the main window of the program and call up a new chart to be calculated. SCE keeps track of the current charts and well as any frozen charts, so you can do several runs and compare them side by side. The Reset button can be used to reset the chart’s frequency range and resolution back to the values specified in the main Analysis Panel.
The other main results window can be viewed by pressing the Analysis details button on the Analysis panel. Here’s an example of such a window:
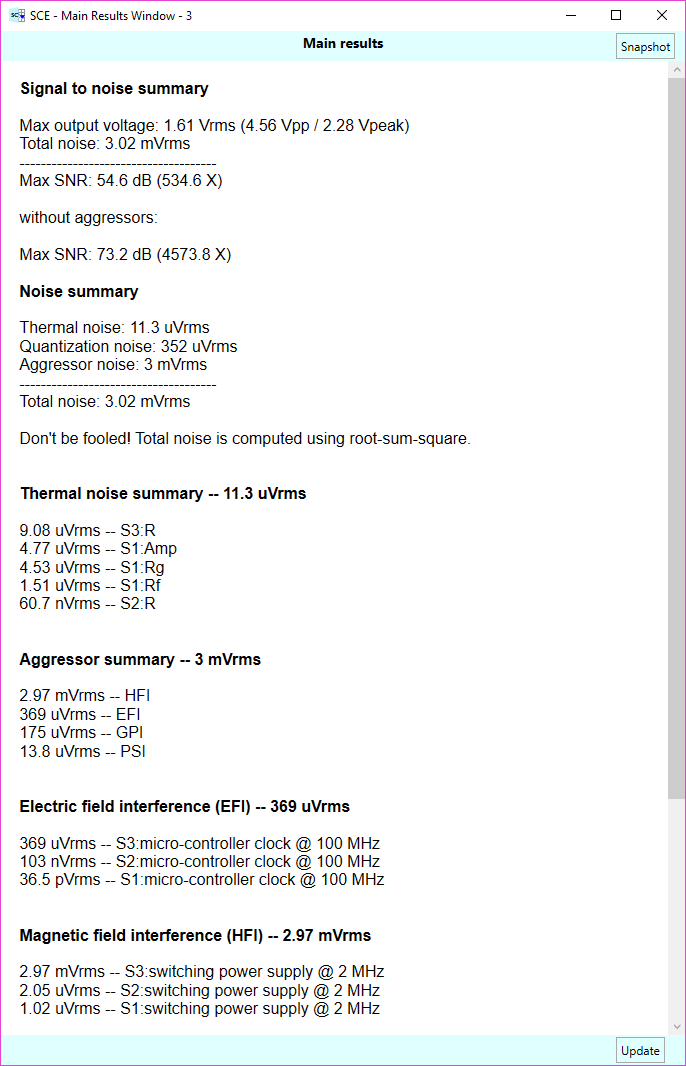
The window starts with a summary of signal strength, thermal noise, quantization noise, and aggressor noise. Below that summary, a more detailed look at each category is given. From these details, you can quickly determine which noise is causing you the most grief, and by how much.
Where do all the aggressors come from? SCE has a built-in set of interference models that you can turn on and off via flags in both the individual stages and at a global high level. For the latter, these flags are called the gargoyle flags, which are located in the upper right area of the main window:
![]()
These flags — and their underlying computations — are a signature feature of SCE that sets it apart from other signal chain analysis tools.
The Gargoyles! check box is the master switch for turning the interferers on and off. With this switch, you can quickly see the effects of interference on your signal quality.
NOTE: You must press the Analysis Panel Update button to see the effects of the switches.
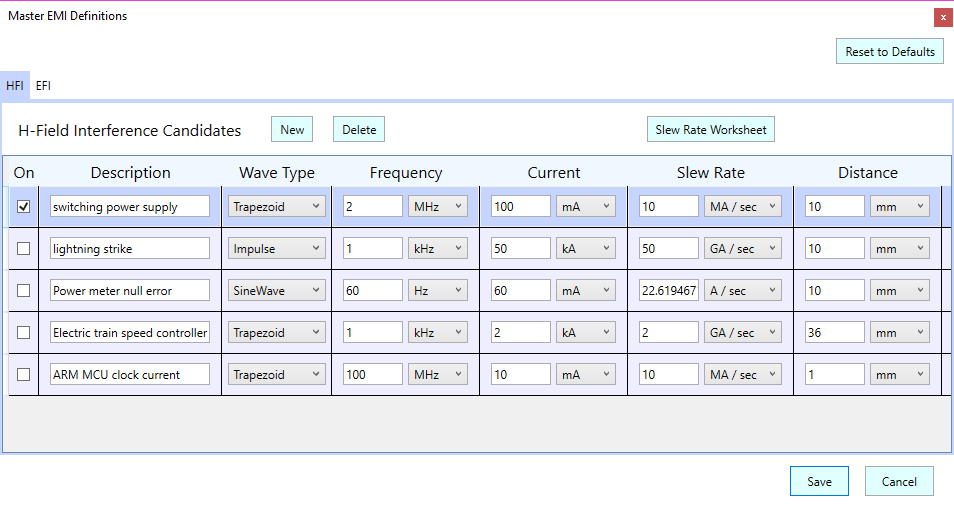
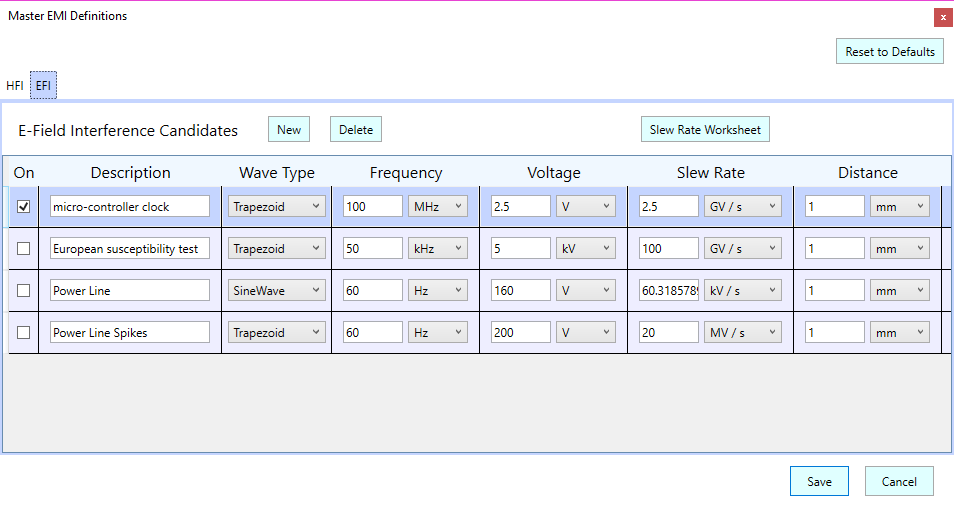
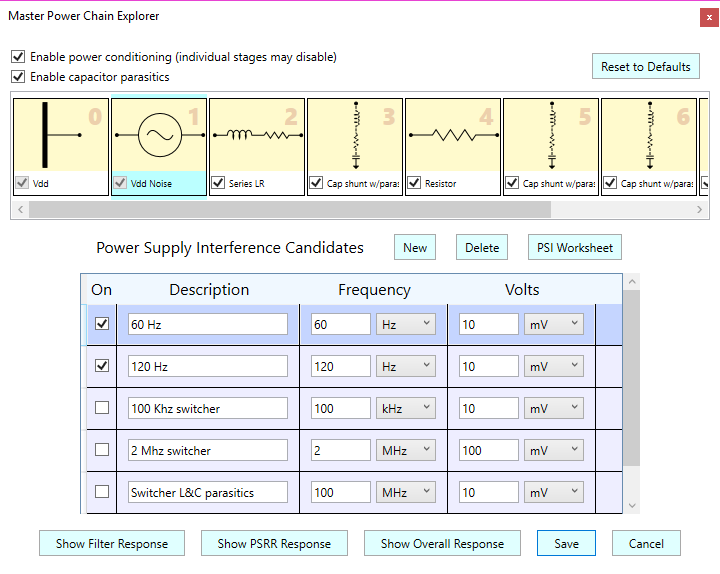
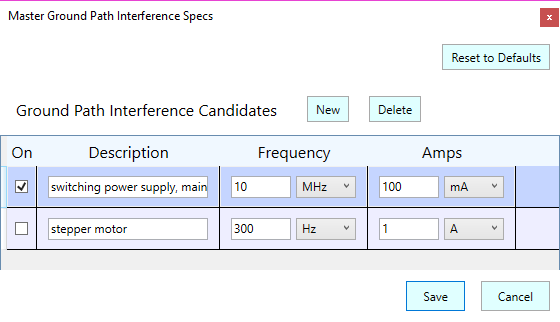
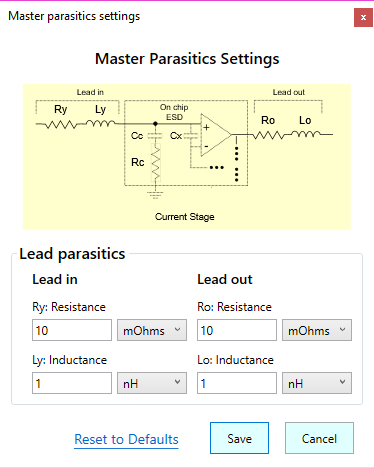
To the right of the master switch is a set of check boxes for each type of gargoyle. These are: HFI (H-field interference), EFI (E-field interference), PSI (power supply interference), GPI (ground path interference), Parasitics (such as chip ESD structures), and I/C (interconnect interference).
These check boxes serve as master switches for the respective types of interference, and control the interference for all stages in the signal chain. So, for example, if you only want to see the effects of HFI, you can turn on the HFI check box and turn off all the other check boxes (except the master checkbox, or course).
Along with these master switches, you can also control the interference at the individual stage level. In other words, the gargoyle master flags determine the type of gargoyles to used, and the stage flags determine which stages have those gargoyles turned on. The logic works like this: In order for a particular gargoyle to be turned on for a particular stage, it has to be enabled in both the stage and master gargoyle list.
Gargoyle Database
SCE comes with a built-in database of gargoyles that you can use and modify for your stages. There is a master set of gargoyles, one for each gargoyle category. You can customize these by adding/modifying the entries. Whenever a certain type of gargoyle is switched on, the corresponding gargoyles from the master set are used. You can, however, individualize the gargoyles for each stage as well.
NOTE: In the current preview version of SCE, changes to the gargoyle database cannot be saved. We hope to add this functionality in the near future.
Below are screen shots showing the master gargoyle settings for each category. These can be obtained by clicking the labels next to the gargoyle check boxes, which serve as popup buttons for these settings:

Noise Panel
Below the main Analysis Panel is a panel that summarizes the noise present in the signal chain, in the form of thermal noise, quantization noise, and noise caused by any aggressors (the gargoyles). Also included is the maximum thermal transient distortion caused by the heating (and cooling) of any resistors and op-amps in the signal chain.
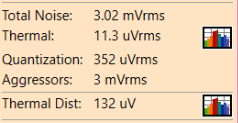
The thermal noise and transient distortion areas both have icons that can be clicked to pop up charts with more details. These charts show results in both graphical and list form and are plotted against frequency. Here’s an example of clicking the thermal noise chart icon:
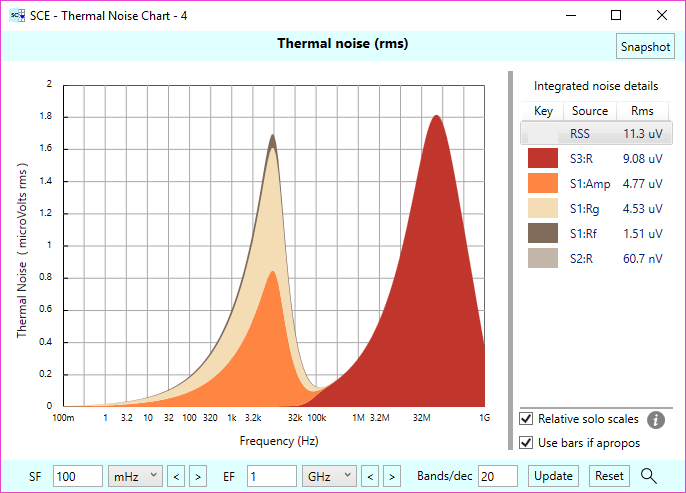
NOTE: See Understanding Sce Thermal Noise Charts for a detailed look at SCE’s thermal noise charts.
A sister chart to the thermal noise chart is the one for thermal transient distortion, which can be shown by clicking the chart icon to the right of the thermal distortion value:
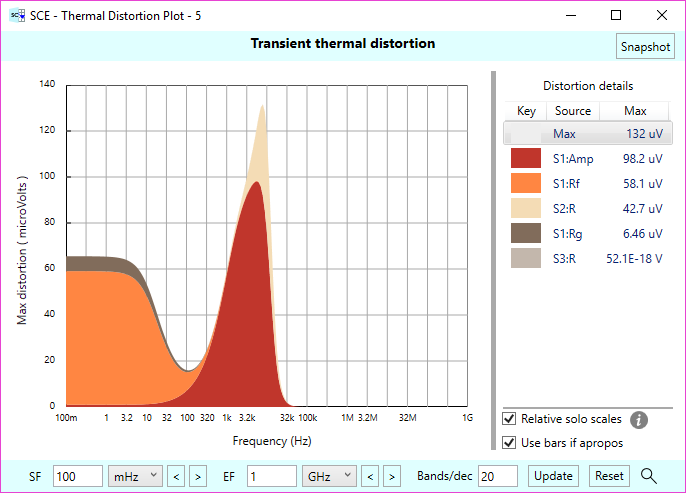
For an example of how such a chart might be used, see the post Noise Distribution Considerations for a Multi-Stage Audio Amplifier.
NOTE: The thermal distortion analysis in SCE is one of the unique features of the product. It’s still undergoing research and development. What’s given here is a glimpse of what might be possible to compute and show. We welcome comments and debate about what should be included, and how it should be interpreted.
Required Signal Power
Another unique feature of SCE is its computation of required signal power. When a signal chain analysis is run, SCE computes both the voltage and current at the sensor. From this, the power draw through the sensor can be determined. The power draw at the frequency of interest is shown below the thermal noise and distortion panels. For example:
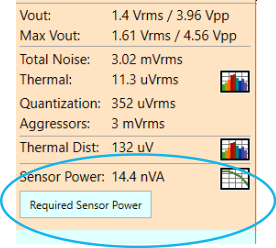
The sensor power heavily depends on the ENOB/SNR of the signal — the higher the ENOB/SNR, the higher the output voltage (needed to overcome the noise in the system), and this requires more gain in the system and/or a higher sensor voltage (or current, or both). By clicking on the Required Sensor Power button, SCE let’s you compute the required sensor power needed for a specified signal quality, given the signal chain entered, and at the frequency of interest. Here’s the dialog that pops up when clicking the button:
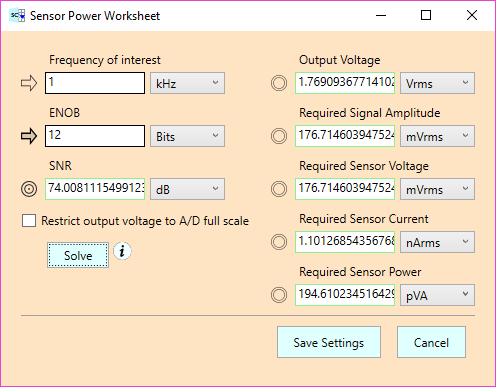
Here, we’ve specified a 1 kHz frequency of interest and an ENOB of 12 bits. By pressing the Solve button, SCE computes the required output voltage of the signal chain, and by inference, the required sensor voltage. By also computing the sensor current, SCE can determine the power needed in the sensor. In this case, 194 pVA, (which is easily doable in this case, we imagine.) If you were to pick a higher desired ENOB, the power requirements go up dramatically. For example, let’s see what happens if you ask for 16 bits of resolution:
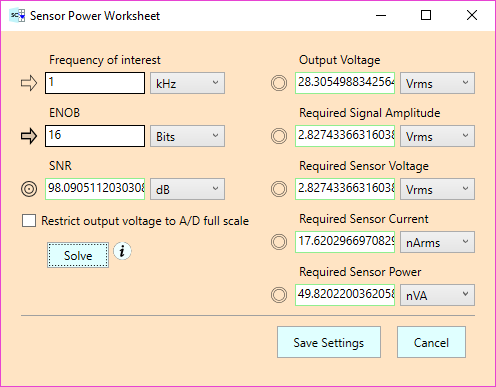
This says we need a sensor voltage of 2.8 Vrms which in turn leads to 49.8 nVA of power. Doesn’t seem too bad, but look at the necessary output voltage (to overcome the noise in the system) — over 28 Vrms! Ouch!
For a detailed look at this unique feature of SCE, there are series of blog posts covering the subject, starting with Required Sensor Power – Part 1.
Stage Input and Output Impedance
By now, you should be getting the idea that SCE is chock-full of unique features. There’s another set we’d like to talk about now — and that is the determination and plotting of input and output impedance at any stage in the signal chain. You can access this functionality by using the buttons just above the stage list:

Using these buttons requires a bit of explanation: The Local InZ and Local OutZ buttons let you see charts showing the input and output impedances of the currently selected stage in isolation (as though the stage is the only one in the system.) By contrast, the InZ and OutZ buttons compute the respective impedances starting at the selected stage and going to the end of the signal chain, in the direction implied by the type of impedance. For example, we can select the amplifier stage (as shown above) and look at the output impedance of the signal chain up to (and including) that stage, by clicking on the OutZ button. A sample result is shown below:

For a more detailed discussion of the use of these buttons, see the blog posts Understanding Input and Output Impedance, Visualizing Op-Amp Impedance Using SCE, and LC Baluns in Action.
Op-Amp Database
For the amplifier stages, you can modify various parameters of the op-amps, such as their DC gain, first order corner frequency, unity-gain bandwitch (UGBW), input resistance, and open-loop output resistance. While these can be set manually, SCE also includes a (currently small) database of pre-defined op-amps modeling op-amps from various manufacturers. At the time of this writing, here is the set of op-amp models that come included with the product:
Generic Buffer Amp
UA 741 (generic)
NE 5532
MCP 6031
MCP 6021
MCP 655
OPA 211
OPA 2134
OPA 2614
MC 33078
LTC 6081
2N4433 bipolar
TLV2771
More op-amps will be added to this list as times goes by. (If you have any you’d like us to include, give us a holler.)
NOTE: The current preview version doesn’t currently allow saving of any custom amp specifications.
For Further Information
This concludes the overview of SCE. There are many more details to the product than what’s covered here. We’ll be fleshing them out in subsequent blog posts. In the meantime, here are some posts and documents already uploaded that can help out. In particular, the first document (which is a PDF you can download) showcases many of the features in the product by way of a real-world example — that of mitigating noise in a thermal sensor signal chain. Please note that the product interface has changed since this document was written, so the screen shots may not match exactly.
The second link is an important one. It’s a download link for a PDF document on how to use the equation fields in SCE. You’ll need to know this in order to use SCE effectively. (We hope to have this as a web page in the near future.)
Managing Interferers in a 12-bit Thermistor Signal Chain
Using Unit and Equation Var Fields
Upgrades to the Sensor Stages in SCE
Understanding SCE Thermal Noise Charts
Understanding Effective Number of Bits
Understanding Input and Output Impedance
Simple Digitized Audio Example
Noise Distribution Considerations for a Multi-Stage Audio Amplifier
Comments
Quick Tour of Signal Chain Explorer — No Comments
HTML tags allowed in your comment: <a href="" title=""> <abbr title=""> <acronym title=""> <b> <blockquote cite=""> <cite> <code> <del datetime=""> <em> <i> <q cite=""> <s> <strike> <strong>