Visualizing Op Amp Impedances using SCE
One of the unique and powerful features of Signal Chain Explorer is the ability to quickly see the input and output impedances of a stage, both “locally” (stage by itself) and “globally” (backwards or forwards to the beginning or end of the signal chain.) The former we call “local impedance.” The latter, global impedance. We showcased global impedance in an earlier article LC Baluns in Action. If you haven’t read that article, you should check it out. You’ll get to see how valuable it is to be able to easily and graphically verify that the LC Baluns are doing the impedance matching they were designed to do.
Now, in this Short and Sweet article we take a look at input and output impedance as they pertain to op-amp stages. If you’ve never had the opportunity see these amp stage impedances visually, you might be surprised by the results.
The impedance buttons
Before we get started, we want to point out where the buttons are that allow you to see the various types of impedance. They are located just above the signal chain panel:
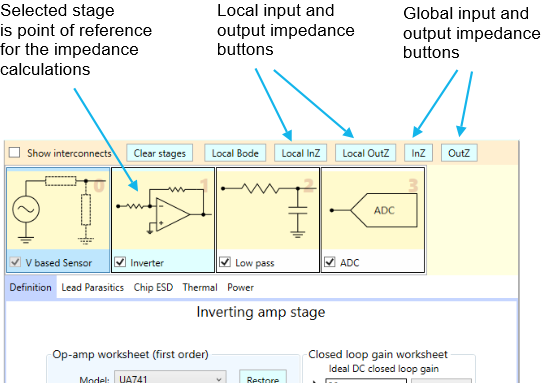
NOTE: If you are following along with this article by running SCE, pay very close attention to which impedance buttons you push. The local impedance buttons return very different results from the global impedance buttons. And be careful which stage is selected. Don’t be fooled!
UA741 gain follower (non-inverting stage) impedance
We’ll start by adding a closed-loop voltage gain follower stage to a signal chain, and then look at its local input and output impedances. The stage circuit is as follows:
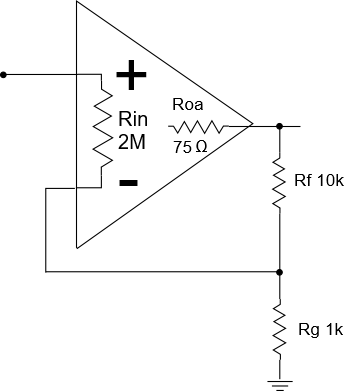
Here, we’re using a UA741 op amp, along with a closed loop feedback resistance of 10 K and shunt resistance of 1 K. We’ve annotated two key features of the op-amp as pertains to impedance: The amp’s input resistance Rin (the differential input resistance) and the open loop output resistance Roa. While many are familiar with the high input resistances of op amps (in this case, 2 MOhms), the other end of the amp, the output resistance, (in this case, 75 Ohms), often gets ignored. But you’ll learn in this and other articles to come that you should definitely pay attention to Roa.
NOTE: If you don’t want surprises in your signal chains, knowing the output resistance is a very valuable piece of information to have, but finding its value can be tricky, as datasheets for op-amps may not specify it directly, but may infer it with graphs, and/or specify instead the closed loop output impedance (which we will be illustrating in this article) at one or more frequencies. In an article to come, we’ll show how you can determine the open loop output resistance both from datasheets, and by testing on the bench.
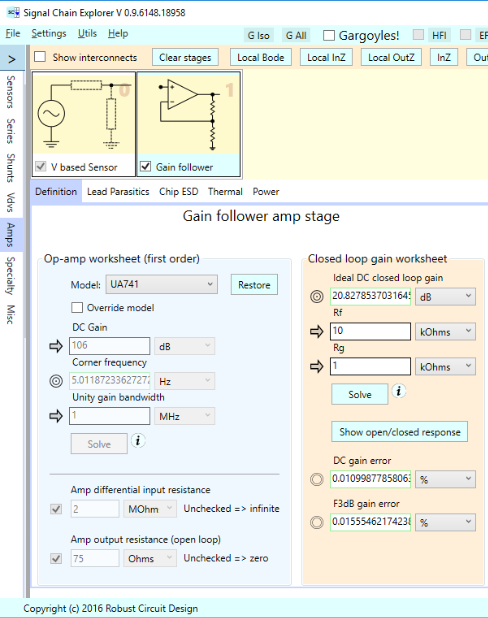
Here’s how the UA 741 gain follower is set up in SCE. Note the open loop gain of 106 dB, and closed loop gain of around 21 dB set by the external resistors. This op-amp has a unity gain bandwidth of 1 MHz, and an open loop corner frequency of 5 Hz:
Gain follower input impedance
When it comes to impedance, you might think that the 2 MOhms input resistance is all you need to know when interfacing to the inputs of this op-amp. But that is decidedly not the case! You may not realize that the input resistance of a closed-loop op-amp stage varies significantly with frequency, as shown in the plot below, which was produced by clicking on the Local InZ button with the gain follower stage selected as the stage of interest. The green curve, the magnitude of the impedance, is mainly what we are focusing on:
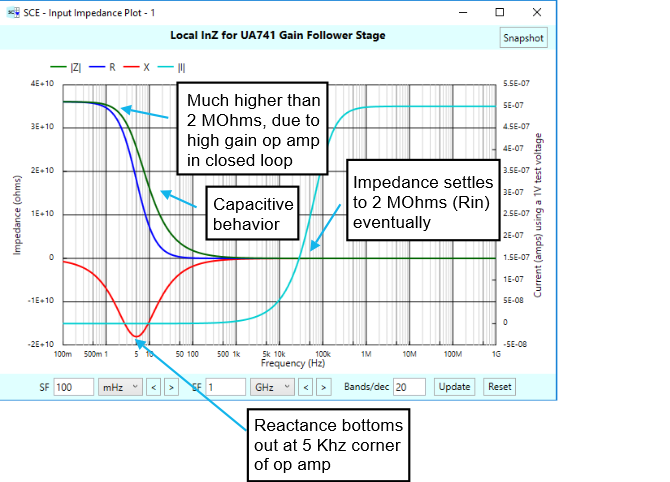
At low frequencies, the input impedance is much higher than 2 MOhms — it’s roughly 36 GOhms! Why? Because of the closed loop behavior of the circuit. When there is plenty of op-amp gain to spare, the circuit tries to force the input and output pins to the same voltage. In doing so, the input impedance rises significantly, being multiplied in part by the op-amp gain. Were the op-amp to be ideal, with infinite DC gain, the input impedance would be infinite as well. This can be seen in the following equation, which shows the formula for the input impedance of our stage at DC. Here, D is the open-loop DC gain of the op-amp:
\(\displaystyle GF InZ(DC)\,=Rin+\frac{{Rg\left( {Rf+D\,Rin+Roa} \right)}}{{Rf+Rg+Roa}}\)
You can easily see that as D goes to infinity, so does this term.
However, as the frequency increases, another term is subtracted from the DC impedance term, where s is the Laplace frequency variable and U is the unity gain frequency:
\(\displaystyle \frac{{{{D}^{2}}Rg\,Rin\,s}}{{\left( {Rf+Rg+Roa} \right)\left( {Ds+U} \right)}}\)
This subtracted term causes the capacitive-like roll off of the impedance (realize that the impedance plots are linear in Y), until the impedance settles on the 2 MOhm input resistance, which occurs out past where the op-amp can no longer deliver gain (ie., past the unity gain frequency). The following zoomed in plot shows this:
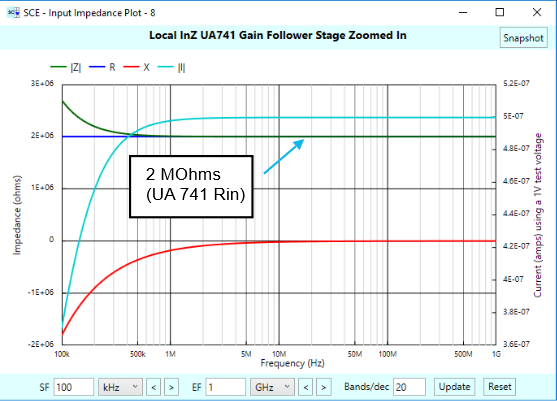
We aren’t usually privy to such detailed equations as shown earlier when thinking about op-amp behavior, but that’s okay, SCE’s impedance plots show us what will happen anyway, and these graphical plots are very informative. We note with interest from the original InZ plot that the reactance bottoms out right at the op-amp’s corner frequency of 5 Hz. We don’t know what that implies.
We recap the behavior of a gain follower: At DC, a gain follower has very high impedance. At intermediate frequencies, the stage input looks like a capacitor. A high frequencies, the stage takes on the input impedance of the op-amp itself.
Gain follower output impedance
The following plot shows the local output impedance of our gain follower stage:
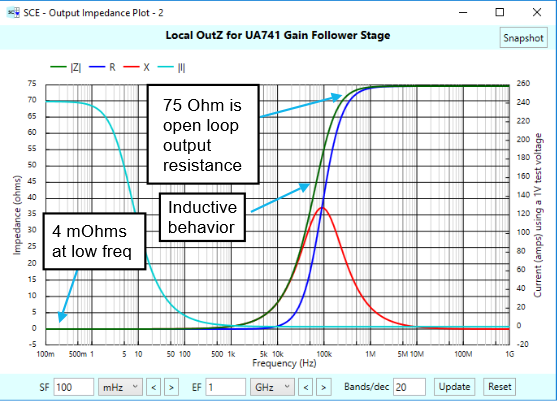
As was the case with input impedance, the output impedance of a closed loop gain follower varies by frequency, due to the closed-loop behavior of the stage. At low frequencies, our stage has very low output impedance — a desirable quality that makes the device easy to use, with minimal losses. However, at intermediate frequencies, the stage looks more like an inductor, the consequences of which we’ll explore in a bit. At high frequencies, out above unity gain, the stage takes on the open-loop resistance of the op-amp itself.
Beware the output resistance!
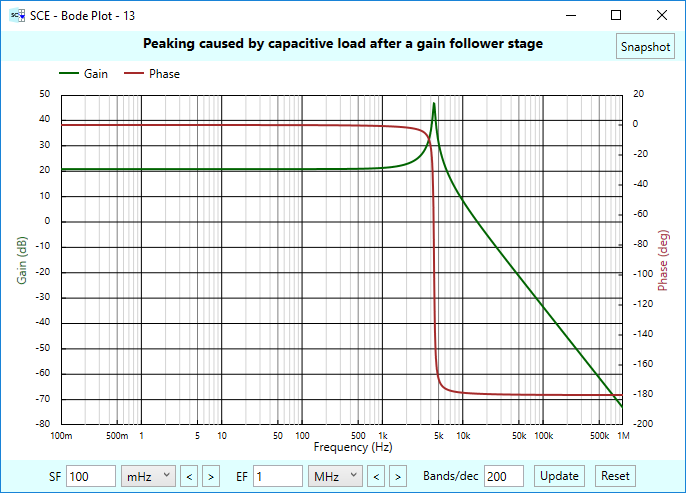
Because of the inductive behavior of the output impedance of a closed-loop gain follower stage, you must be careful when hanging non-resistive loads on the output. For example, should you have a capacitive load, it will combine with the inductive behavior to create in effect a second-order system, and as you might be aware, such systems can have resonant peaking, and can even oscillate out of control.
For example, let’s put a 10 uF capacitor shunt after the gain follower stage:
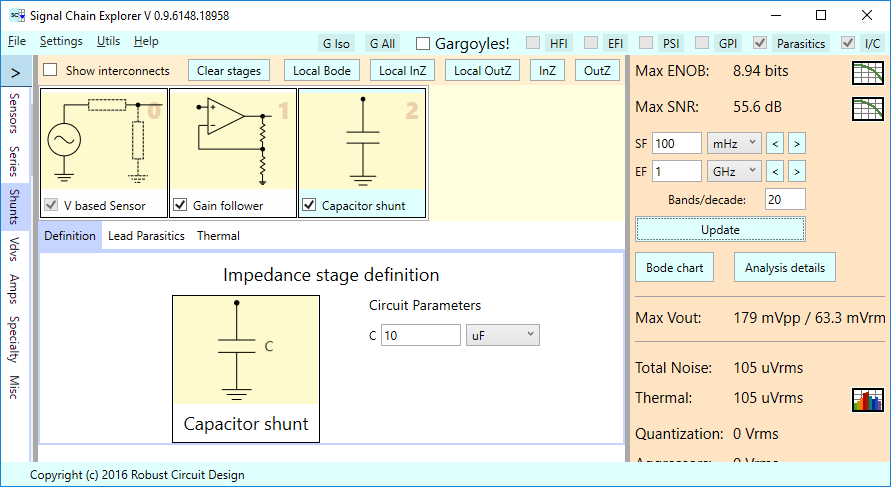
Here’s the resulting Bode plot. Notice the classic second order response, and the 25 dB of peaking.
Isolation Effects of a Gain Follower Stage
It’s well known that gain follower stages (remember, another name of non-inverter) are good at isolating one side of your signal chain from the other. In this section, we’re going to see this graphically, using the global impedance buttons, as opposed to the local impedance buttons.
Below is a signal chain consisting of a phono cartridge sensor having 1,550 Ohms series resistance and 650 mH of series inductance, (you saw this sensor in use in the posts Simple Digitized Audio Example and Upgrades to the Sensor Stages of Signal Chain Explorer), followed by a parallel RC shunt stage of 47 kOhms and 200 pF. Following this is a gain follower stage.
Let’s first see what the overall output impedance is of the circuit consisting of just the sensor and RC shunt stage, without the amplifier stage. We can do this by selecting the shunt stage to be our current “stage of interest”, and then clicking the global OutZ button. This has the effect of showing the output impedance by looking backwards from the shunt stage to the sensor stage.
Below is the arrangement of our signal chain and how we select the appropriate stage and use the appropriate output impedance button:
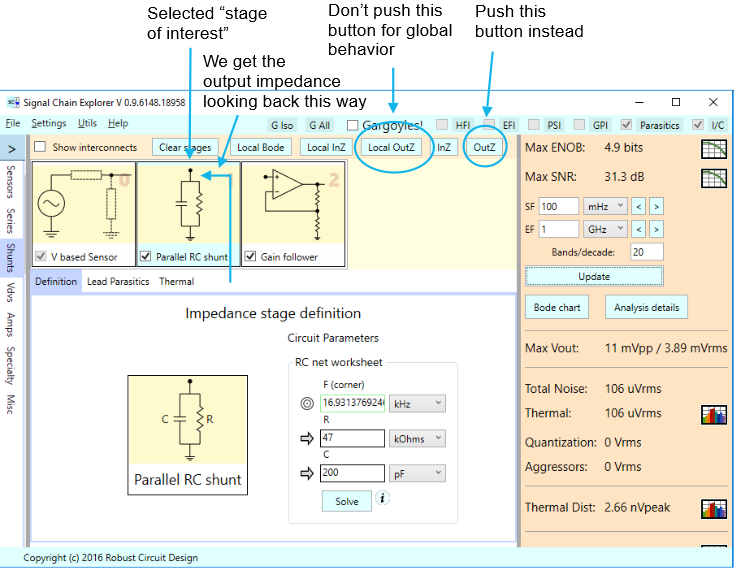
Here’s what we get for output impedance:
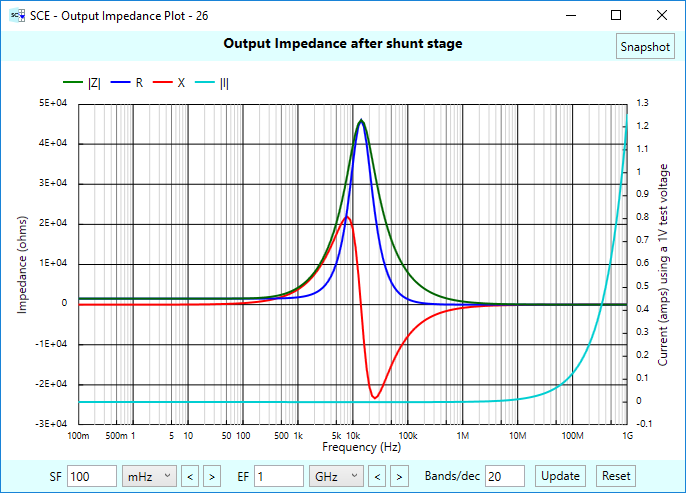
There are some interesting things going on around 11 kHz. Let’s see what happens if we use our gain following to isolate the rest of the signal chain from this. To do so, select the gain follower stage as the “stage of interest” and press the global OutZ button:
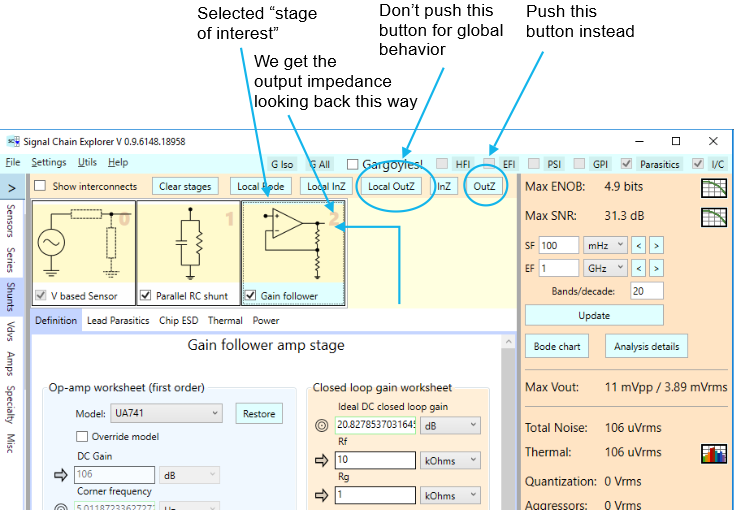
Here’s the resulting impedance plot:
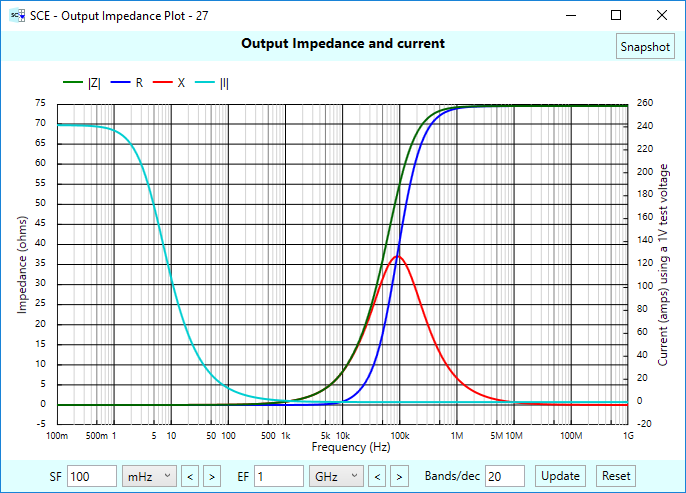
It’s the same plot we saw earlier for the “local” input impedance of the amplifier stage. So the gain follower does a good job of isolating any stages to the right (we have none in our example) from the effects of the phono cartridge and termination shunt stages to the left.
UA741 inverter stage impedance
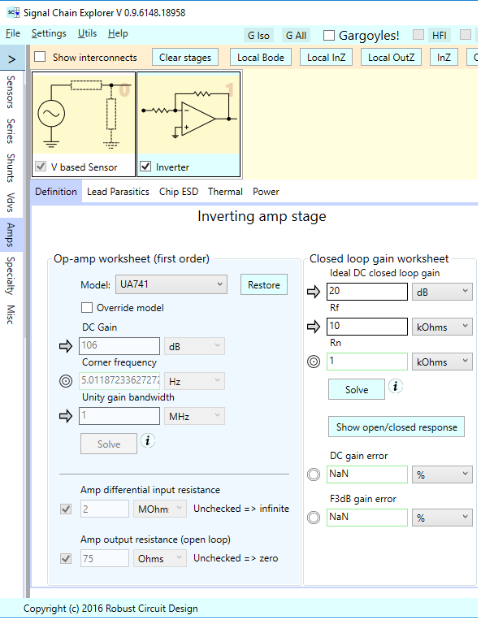
Now it’s time to switch gears and look at the impedances of an inverter stage. We’ll use the same UA741 op-amp as before, and the same feedback resistor of 10 kOhm, and we’ll use a 1 kOhm input resistor:
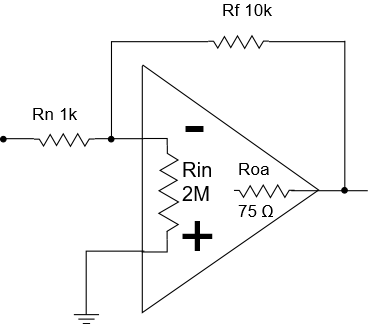
The following figure shows the setup in SCE:
Inverter local input impedance
Okay, what do you suppose the input impedance of our inverter stage is? 2 MOhm? 36 GOhm like we got for the gain follower?
How about 1 kOhm — at least at low frequencies. The following plot tells the tale:
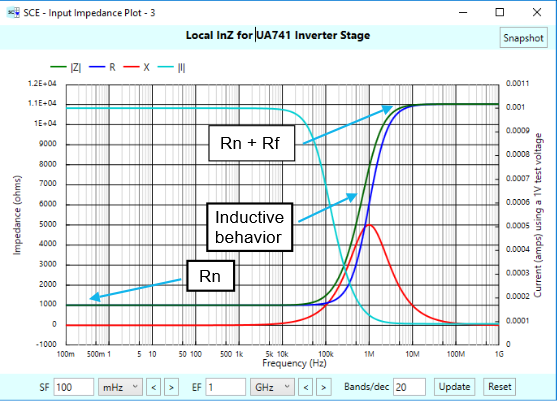
At low frequencies, the input impedance is simply the resistance of our input resistor of 1 kOhm. But then, at intermediate frequencies, the impedance rises with an inductive-like behavior, and then eventually settles to 11 kOhm. Note that 11K = 1 K + 10K = Rn + Rf.
This is a very different plot from our gain follower input impedance, which started very high, went capacitive, and then settled to the input resistance of the op-amp itself. With the inverter, the input resistance of the op-amp is out of the picture. Why? Hmm…, looks like another article is in order, and we’ll leave that for another day.
We note with interest the reactance peaks at 1 MHz, the unity gain frequency of our op-amp. We don’t know the implications of that.
Inverter local output impedance
Okay, now let’s see what the local output impedance of this puppy looks like:
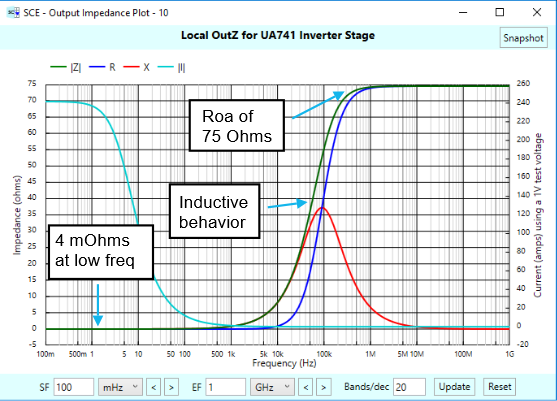
Interestingly enough, it’s identical to the output impedance of our gain follower stage! Hmmm, wonder why that is. (Maybe we’ll investigate this too in another article.)
But what about the isolation characteristics of our inverter? Will it isolate the stages to the right from the stages to the left? Let’s find out. Remember our signal chain earlier, where we had a phono cartridge sensor and then a shunt termination stage before the gain follower? We could build the same circuit, but use an inverter instead, and then look at the overall output impedance. The figure below shows the result:
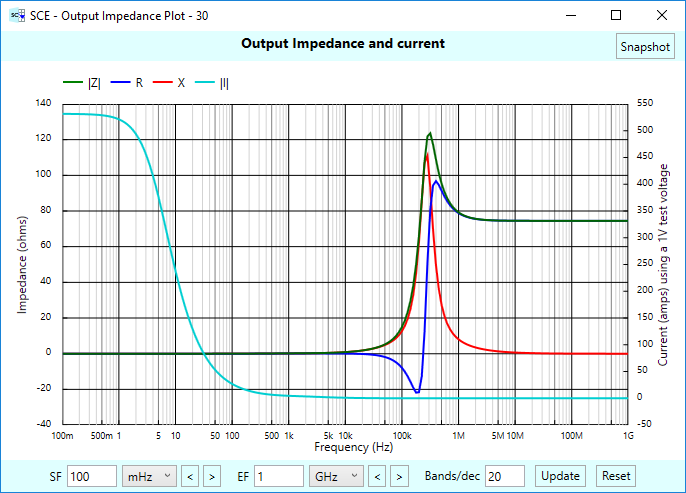
Yikes! We can see the effects of the phono cartridge “bleed through”. How does this occur? There is a direct path from input to output in the inverter stage, passing through Rn and then Rf, but not needing to pass through the op-amp at all. That’s how the stages to the left of the amp stage can affect the stages to the right.
We’re sure there’s plenty more we could investigate right here about op-amp impedances and the like, but we’ll leave that for another day and dollar. Besides, this Short and Sweet article is getting a bit long.
But don’t let that stop you from further exploration using the unique and valuable impedance plots of Signal Chain Explorer! We hope you realize that you can use the local and global impedance plots at any stage of any signal chain, even complicated ones. We think being able to easily visualize the impedance functions will prove to be a powerful tool.
Comments
Visualizing Op Amp Impedances using SCE — No Comments
HTML tags allowed in your comment: <a href="" title=""> <abbr title=""> <acronym title=""> <b> <blockquote cite=""> <cite> <code> <del datetime=""> <em> <i> <q cite=""> <s> <strike> <strong>