Simple Digitized Audio Example
In this Short and Sweet blog post we’ll take a quick look at using Signal Chain Explorer to analyze a simple vinyl-to-digital audio signal chain, consisting of a Shure M97XE vinyl cartridge pickup, a twisted pair connection to a parallel RC termination shunt, then an amplifier stage including RIAA equalization, a low pass filter, and finally an A/D stage. The idea here is to show you the kind of construction and analysis that’s possible with SCE.
Overall Signal Chain and Results
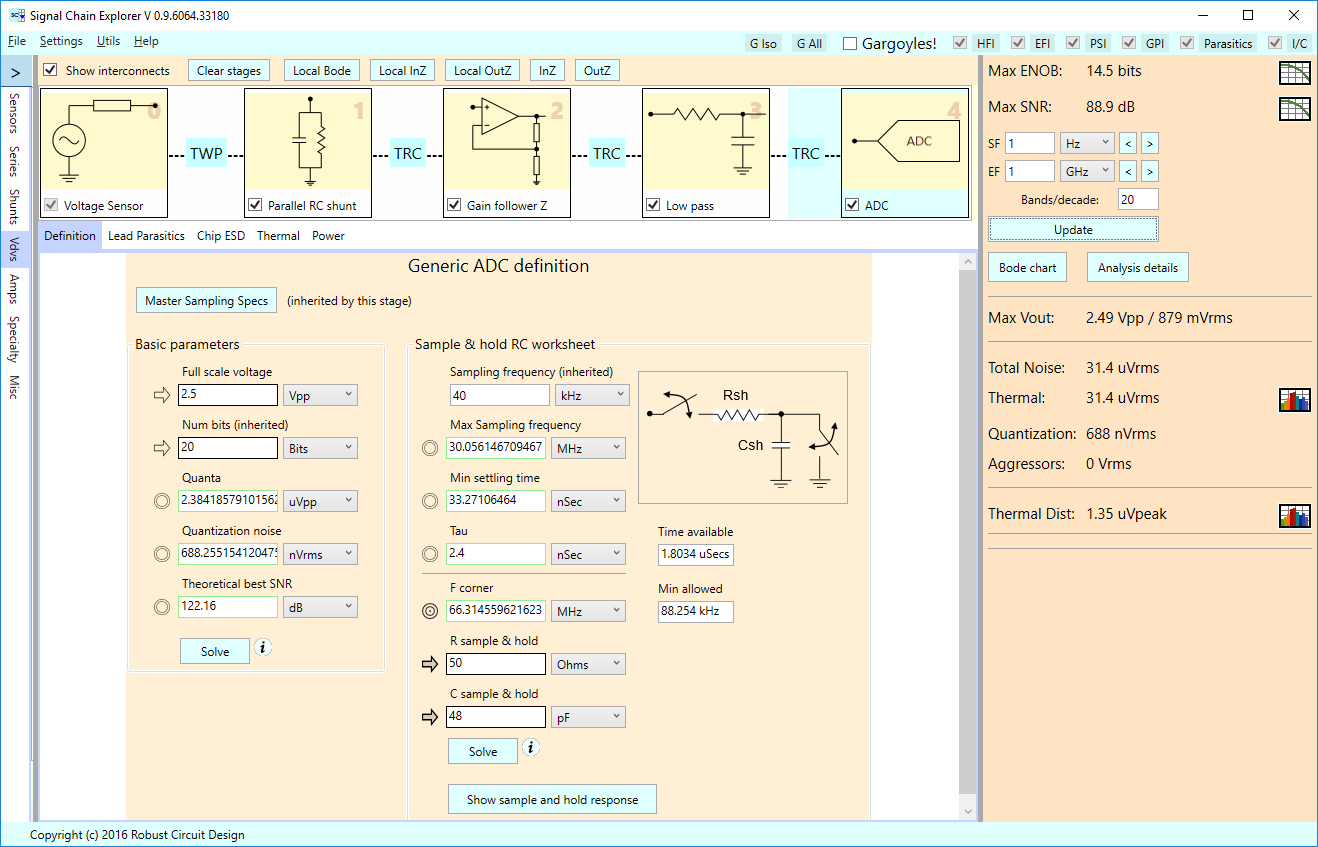
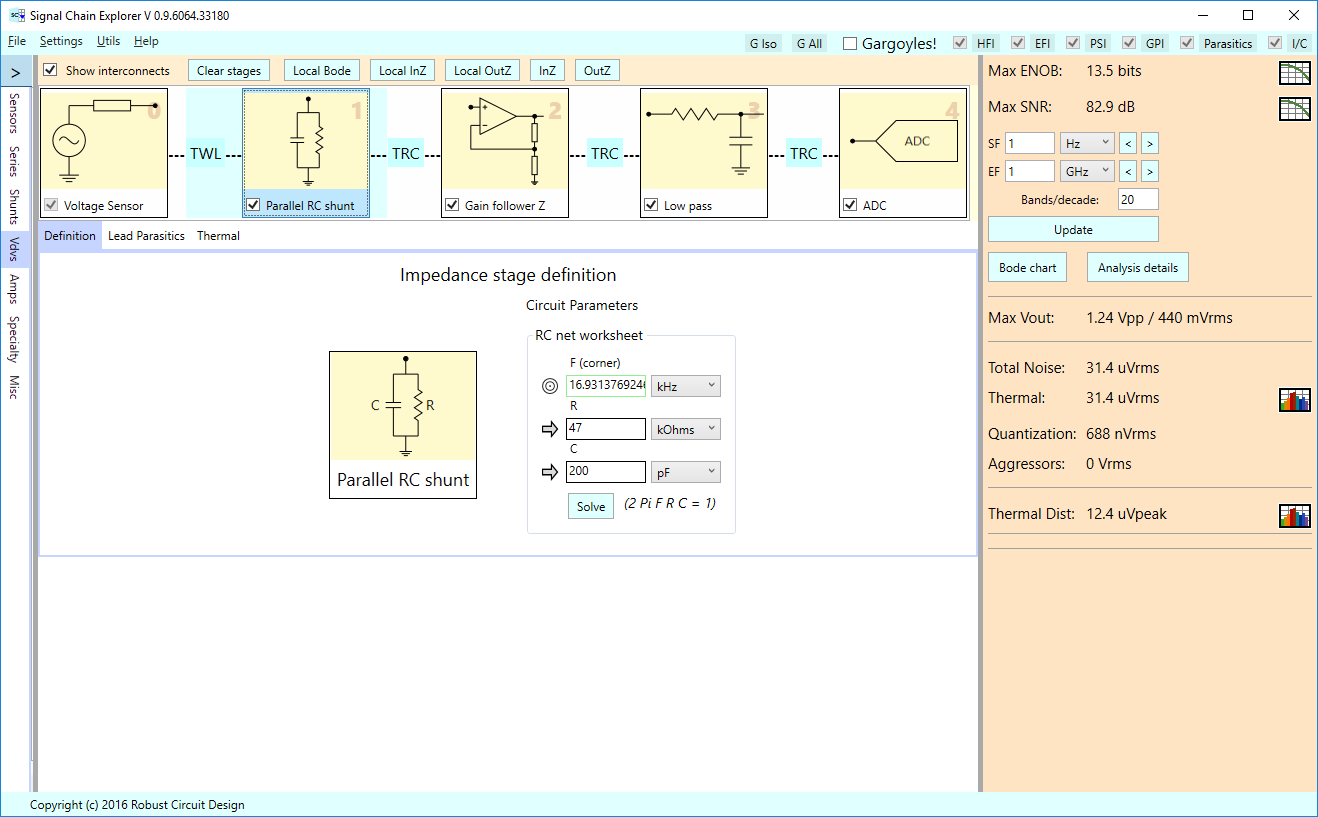
The figure below shows the overall signal chain, along with the analysis results of an SNR of roughly 89 dB, (14.5 effective number of bits.)
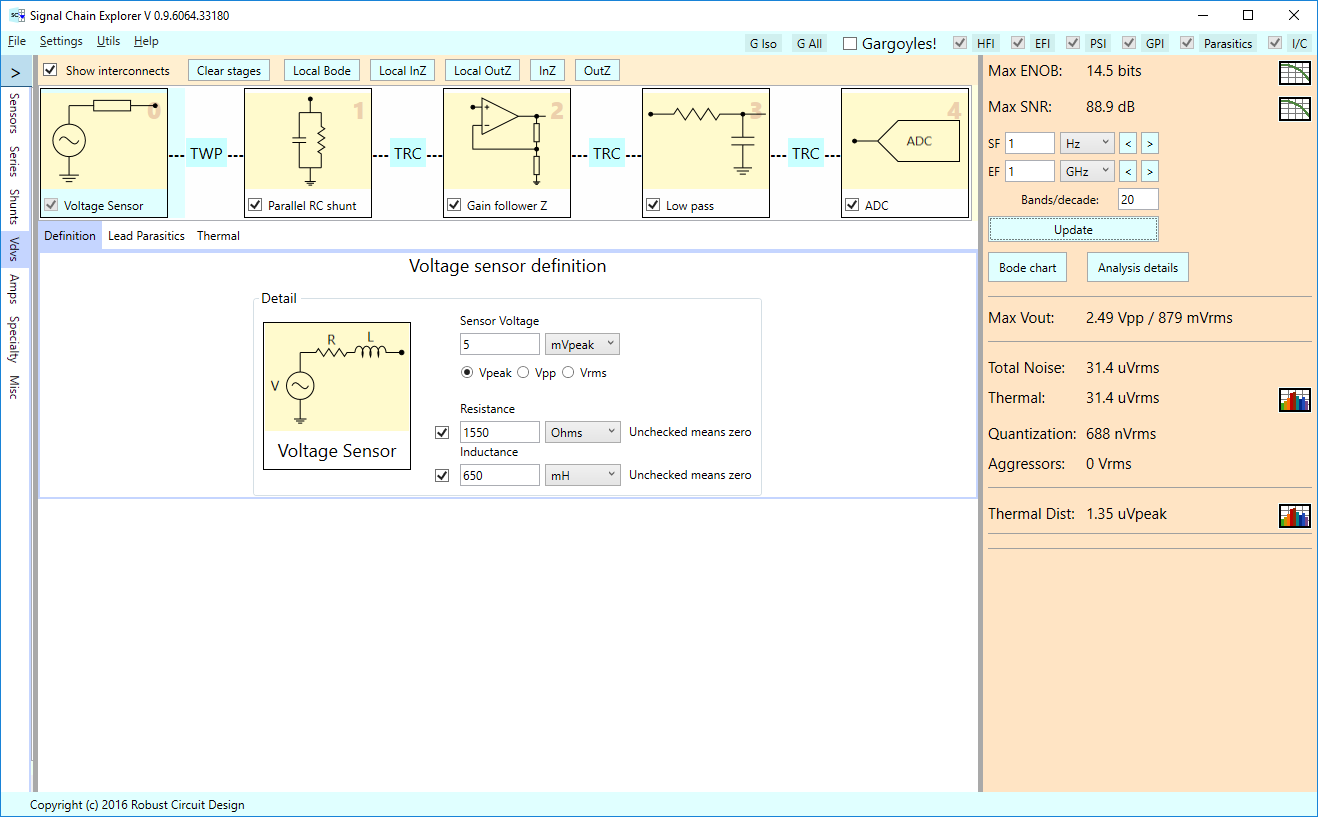
The upper right portion of the main window is the main focus of SCE, showing you the signal to noise ratio and effective number of bits, in this case, 88.9 dB and 14.5 bits. As it turns out, it’s difficult to digitize vinyl audio to even 16 bits of resolution, and you have to jump through a lot of hoops to get that.
The signal chain shown here is not meant to represent the ultimate in phono audio digitization — far from it — but rather, to show you the basics of constructing a signal chain in SCE that processes a phono audio signal and prepares it for digitization. Next, we’ll walk through each of the stages.
Shure M97XE Cartridge Sensor
We start with a “sensor stage”, which in this case represents a Shure M97XE cartridge, having 1550 ohms of series resistance, and 650 mH of series inductance per the Shure data sheet. We’re using a nominal output voltage of 5 mVpeak, which is a rough representative of what the device can deliver. (It’s spec’ed at 4 mVpeak at 1 KHz, using a 5 cm/sec recording velocity.)
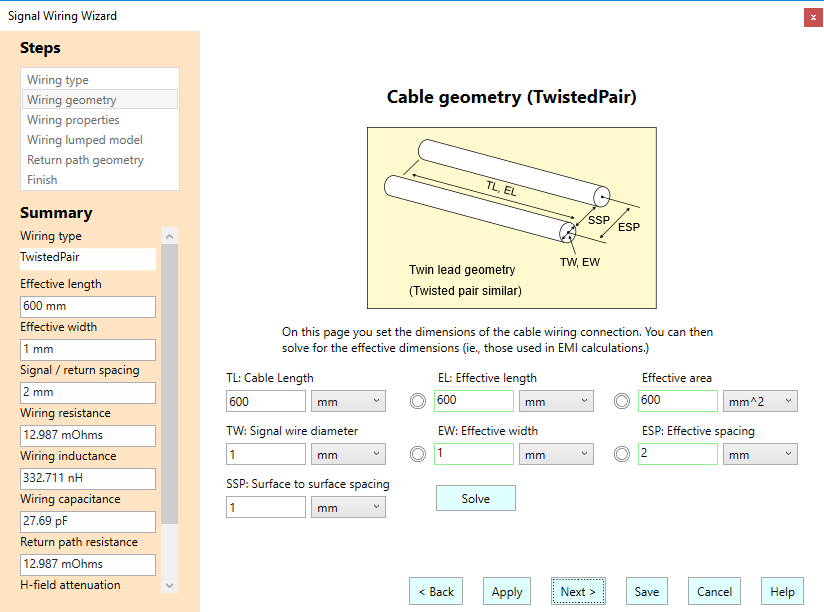
SCE not only models the stages, it also models the interconnects between the stages, be they wires or traces. Here we’ve connected the sensor stage to a shunt termination stage via a twisted pair interconnect, as shown in the next two screen shots: (1) A summary of the interconnect model, and (2) the geometry used, in particular, an arbitrary 600 mm length. For the other stages, we’re using “trace” connections, that is, 14mm long PCB traces.

Cartridge Termination Stage
We terminate the sensor connection with a parallel RC shunt, using a 47 kOHm resistance and 200 pF capacitance, as recommended by the Shure data sheet:
NE5532 Amplifier Stage with RIAA Equalization
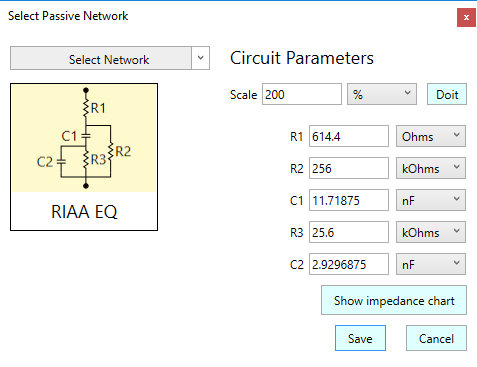
Next, we follow with a single non-inverting amplifier stage (which is called a “voltage gain follower” or “gain follower” in SCE terminology). This gain follower stage is deemed “generic” because we can insert any passive network into the feedback loop, as well as the shunt to ground: In this case, we’ve inserted an RIAA filter into the feedback loop, and a simple 1 kOhm resistor to ground. The closed loop gain definition worksheet on the right side of the stage definition panel below shows this configuration, and we follow that with a screen shot of what the RIAA filter looks like:
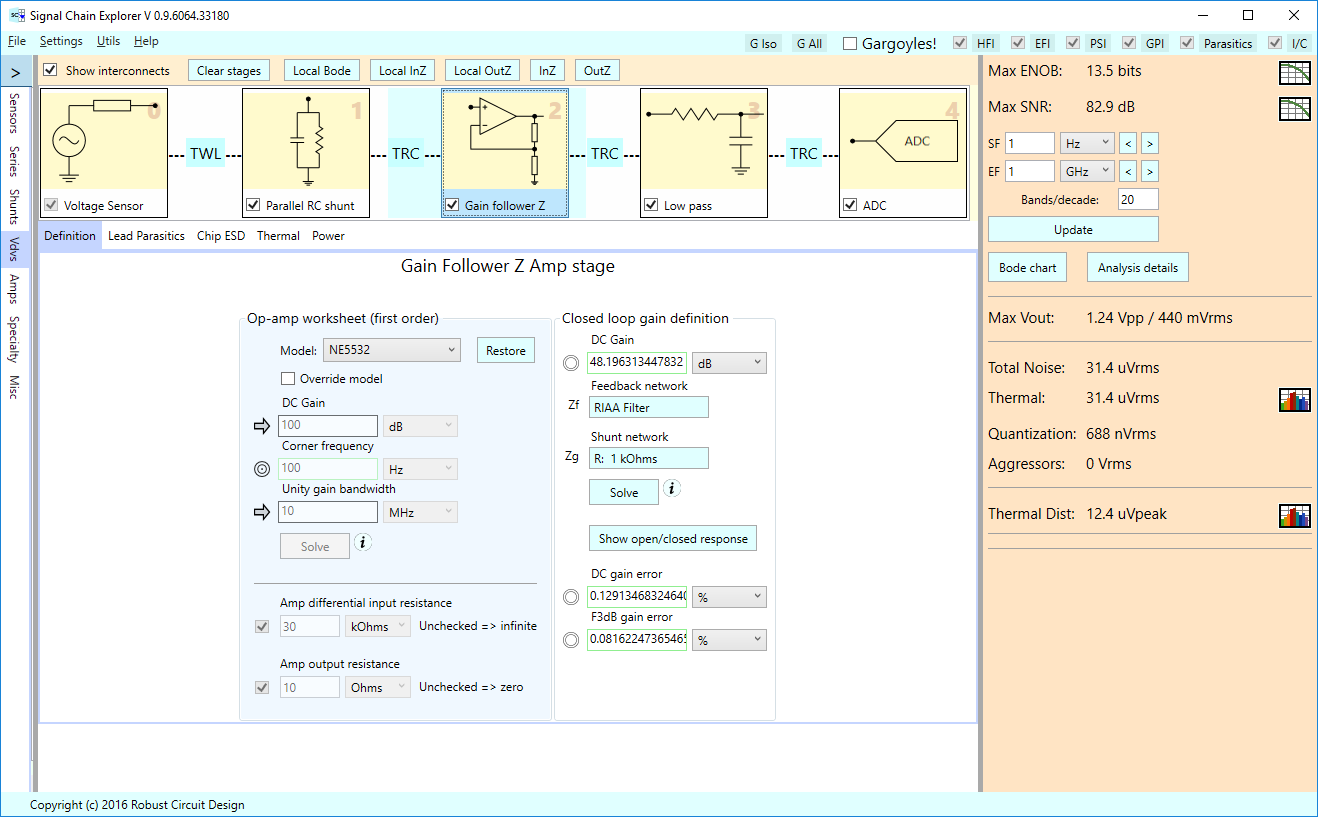
In this amplifier stage, we’ve chosen an NE5532 op-amp which has a DC gain of roughly 100 dB, and a unity gain bandwidth of roughly 10 MHz, as shown in the op-amp worksheet on the right side of the stage definition panel given two screenshots earlier.
One of the useful features of SCE is the ability to compare the open-loop and closed-loop response of an amplifier stage, as shown below for our NE5532 stage with RIAA equalization:
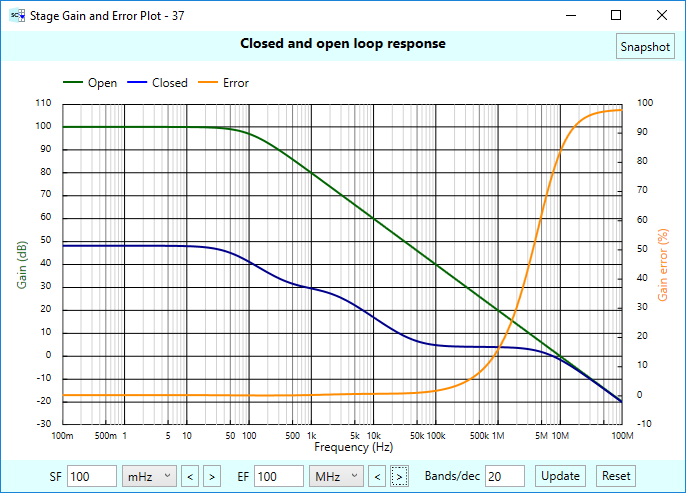
From the closed-loop response you’ll notice a pole at 50 Hz, a zero at 500 Hz, and a pole at 2 kHz. These roughly represent the appropriate RIAA equalization response.
Low Pass Filter Stage
Before the A/D converter, you almost always want to place a low pass filter to reduce any high frequency noise being digitized. Here, we’ve chosen a simple RC filter with a 40 kHz corner:
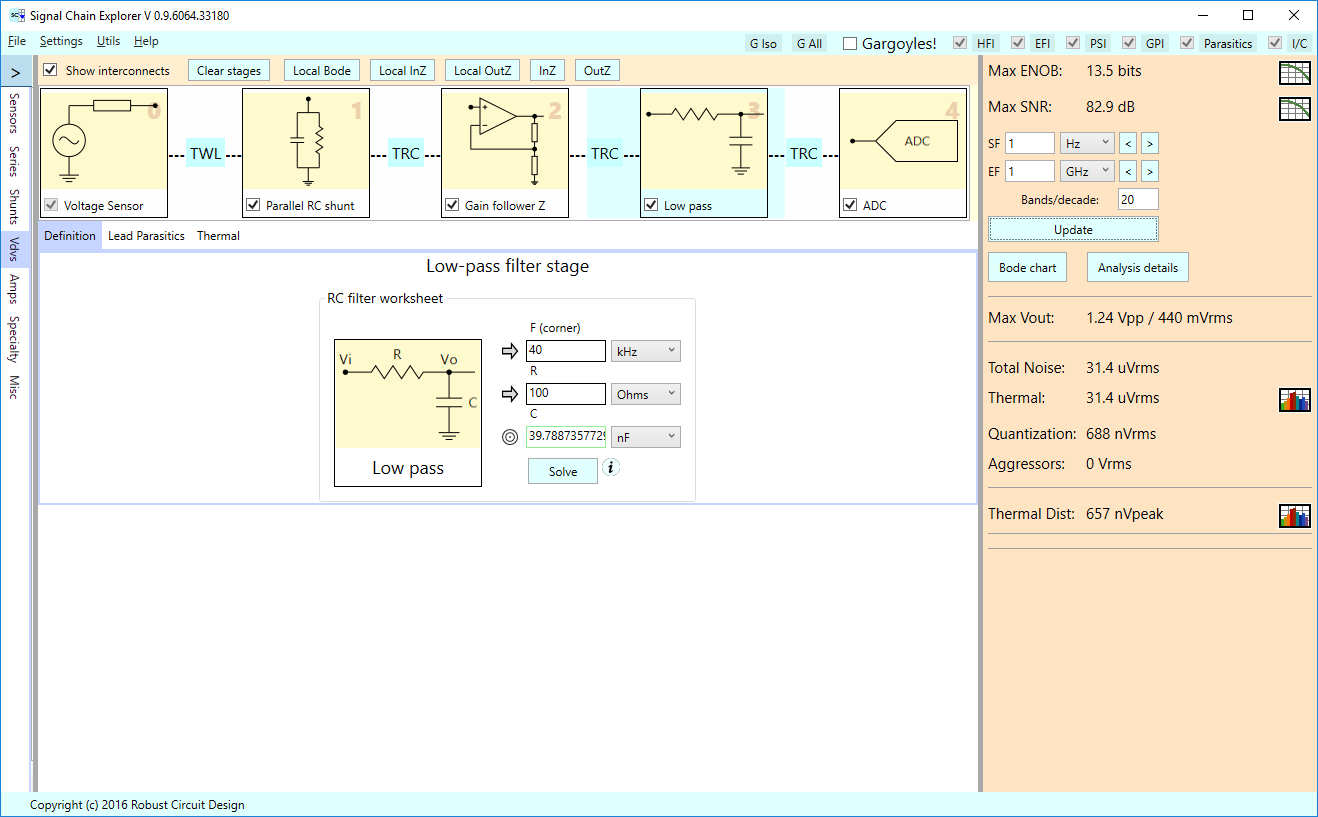
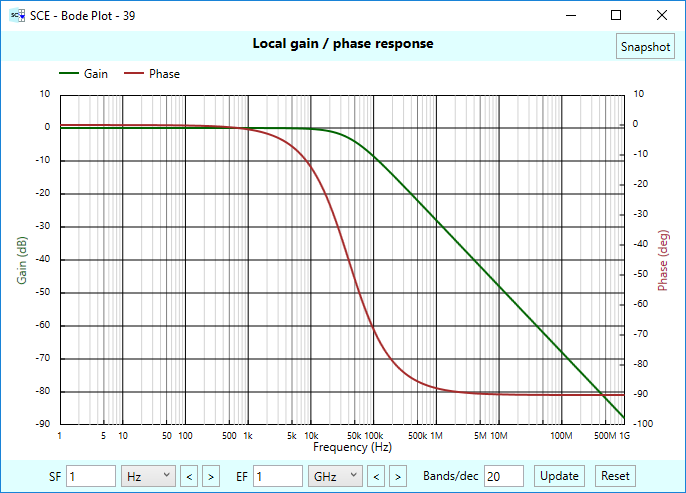
Along with the open-loop, closed-loop plots shown earlier, another useful feature of SCE is the ability to see the “local” Bode plot of any stage. By “local,” we mean the stage in isolation. Here’s the local Bode plot of our RC filter, clearly showing the 40 kHz corner:
Generic A/D Stage
Next, we’ve incorporated a “generic” A/D stage. (By “generic”, we mean we aren’t specifying the A/D to great detail, but instead, only looking at it as a sample & hold device with a given full scale range and bit resolution.) We’ve chosen a 20 bit device (we choose that many bits to keep the quantization noise down) having a 2.5 Vpp scale, and are sampling at 40 kHz (arbitrarily chosen.)
Overall Bode Plot
That’s the whole signal chain. What kind of analysis can we do? First, here’s the overall Bode plot:
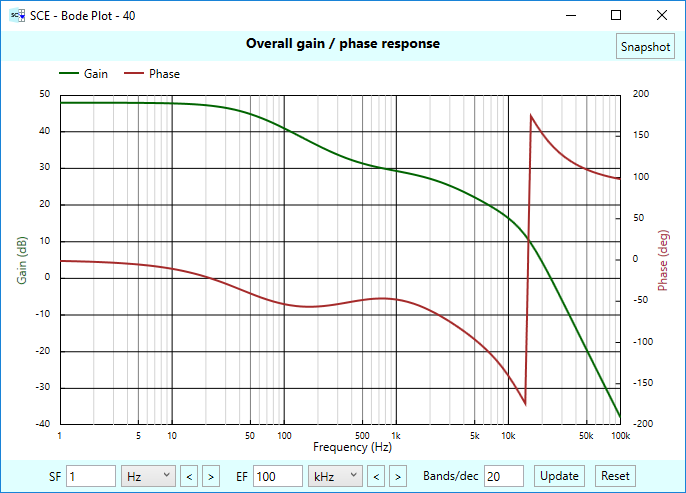
Before you get too scared seeing how much the response drops off at higher frequencies (the 20 kHz response is down roughly 40 dB from the 10 Hz response), remember that the purpose of the built-in RIAA equalization is to reduce the artificial boosting of the high frequencies induced at recording time.
Thermal Noise Sand Paintings
One of the main features of SCE is the ability to see how much thermal noise is injected into our signal chain. Here’s the thermal noise vs frequency plot for our overall system, shown in a form we like to call “thermal noise sand paintings:”
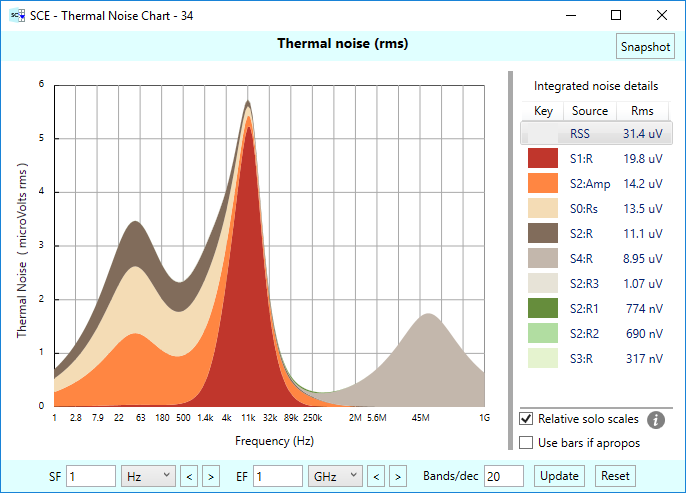
The thermal noise chart is vertically “stacked”. At each frequency, the contributions of each noise source are stacked together, using a RMS-warped scale. The overall height of the curve represents the total RMS noise at a given frequency, and if the whole curve is integrated as a whole, you get the overall RMS noise of the system. In our case here, the noise from the 47 kOhm termination resistor (shown in red) dominates the noise, particularly in the 11 kHz region. Also, notice thermal noise rearing its ugly head out at 50 MHz. This is noise from the sample and hold resistance in the A/D that cannot be filtered out. And do note, the A/D will sample this noise, no matter the frequency, and that this noise can intermodulate down into the audible range. Your only alternative is to use a smaller resistance (and thus higher capacitance) in the sample and hold, or to cross your fingers that the intermodulated noise isn’t too audible.
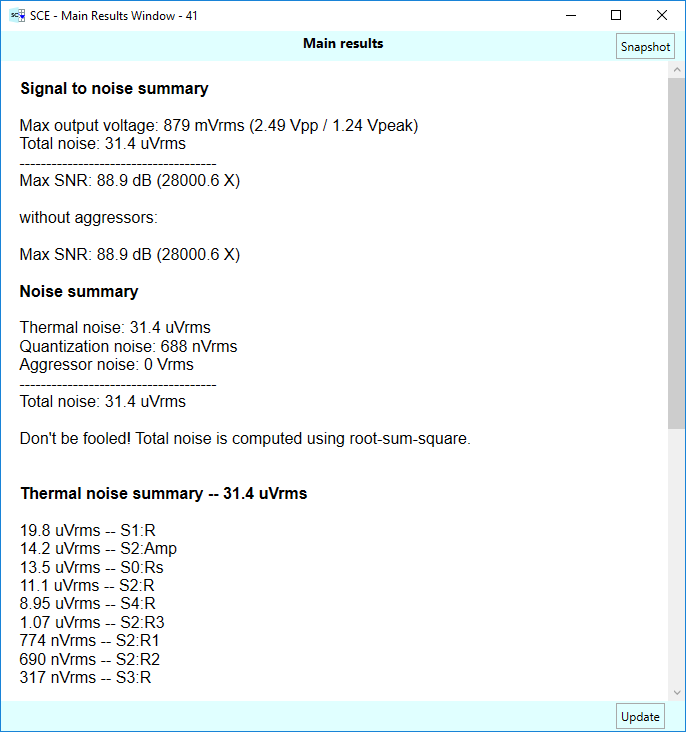
The overall thermal noise of our system is 31.4 uVrms, compared to a signal of roughly 2.5 Vpp (or 879 mVrms). There is also noise due to quantization in the A/D, though in this case it’s down in the nV region. We can inspect the noise contributions in detail using the “Analysis Details” button. Here is the Analysis Details dialog:
Thermal Transient Distortion Plots
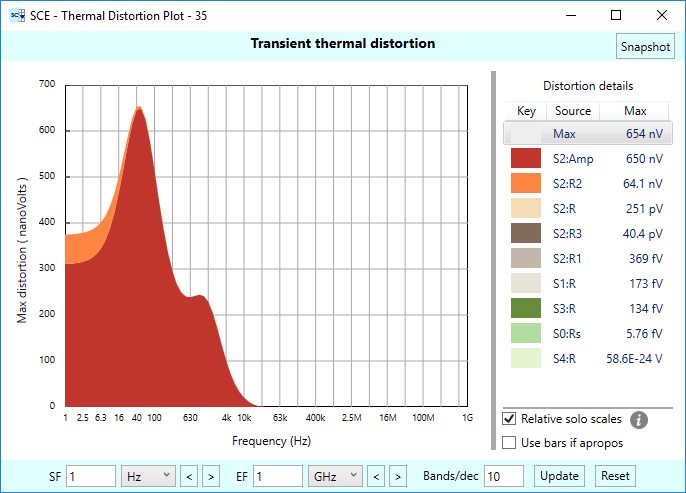
Another unique feature of SCE is the ability to calculate thermal transients (error voltages) caused by the transient change in resistance of components due to heating — in this case, the resistors and any op-amps in the circuit. SCE uses fairly simple worst-case models that give you ballpark estimates of the worst you can expect (that is, it assumes each part’s thermal environment is decoupled from others and/or that the induced errors just happen to swing whatever way gives the worst results.) Here’s the thermal transient plot for our system:
Gargoyles
Last but not least, the most unique feature of SCE is its “gargoyles.” Gargoyles are circuit parasitics plus external aggressors. So we model things like lead parasitics, interconnect parasitics, and then aggressors such as magnetic interference and electric field interference. We also get a handle on power supply ripple interference, and ground plane interference as well. The models used in the current versions of SCE are admittedly simplistic, but they give you a sense of the scale of these problems. It’s invaluable to be reminded that these interferences, these gargoyles, can really make a mess of your signal chain.
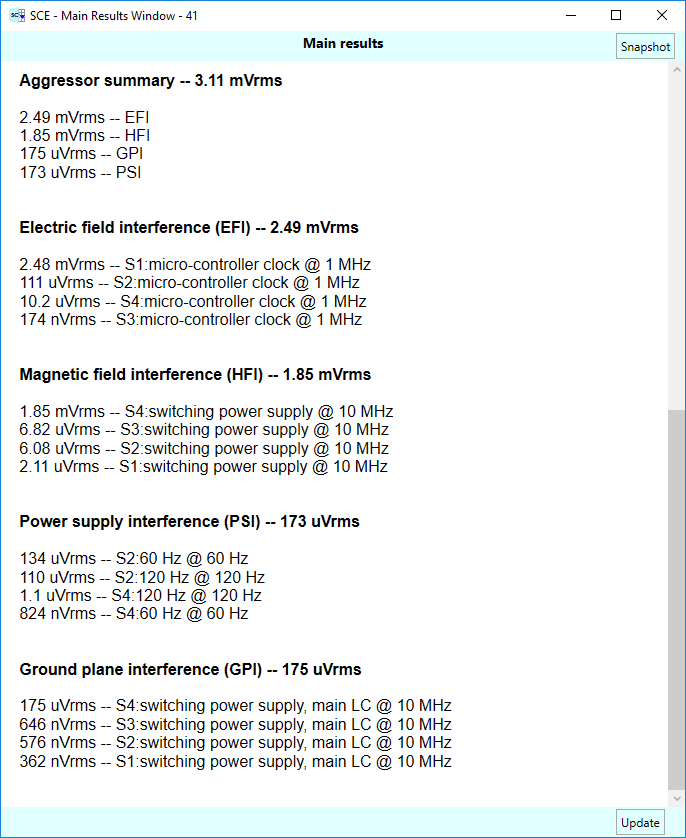
For example, the two screenshots below show the detailed results of turning on the default gargoyles. These defaults include a microprocessor clock line placed too close to the signal line, improperly filtered 60 and 120 Hz ripple from a switching power supply, and interference coupling into our twisted pair leads going from sensor the shunt termination, as well as into the traces between the other stages. Also included are voltage errors induced by non-zero ground plane resistance. Notice how our nice 89 dB SNR (14.5 bits ENOB) gets cut almost in half to 49 dB (7.85 bits).
First, the SNR summary and the thermal noise summary with gargoyles turned on:
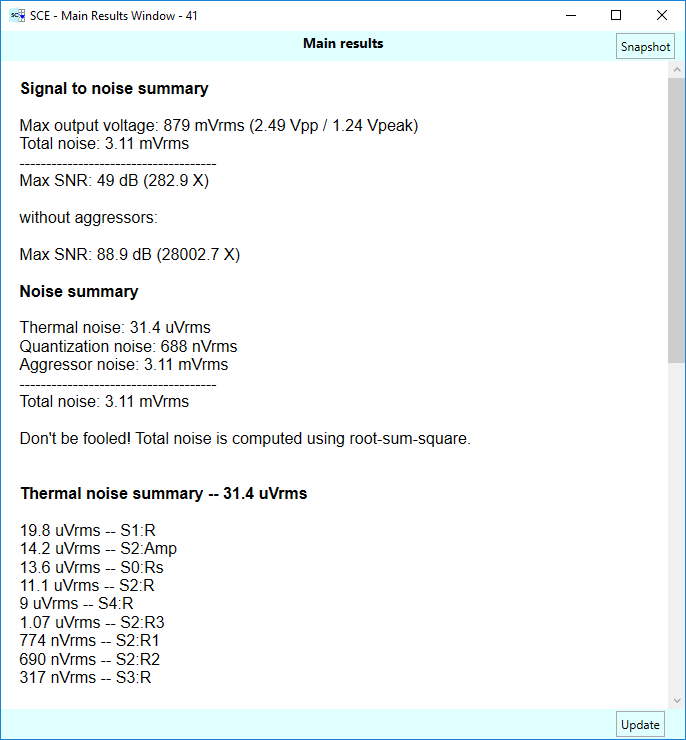
Second, the details of the aggressors. Here EFI is electric field interference, HFI is magnetic field interference. GPI is ground plane interference. And PSI is power supply interference:
Wet your appetite?
This has been a whirl-wind tour through the modeling of an phono audio analog to digital signal chain, including all the things that can interfere with the signal. We didn’t expect you to understand everything that’s going on in the dialog boxes at first glance, but we wanted to give you a flavor of what’s possible with SCE. We hoped we’ve wetted your appetite!
Comments
Simple Digitized Audio Example — No Comments
HTML tags allowed in your comment: <a href="" title=""> <abbr title=""> <acronym title=""> <b> <blockquote cite=""> <cite> <code> <del datetime=""> <em> <i> <q cite=""> <s> <strike> <strong>