LC Baluns In Action
A new feature of Signal Chain Explorer (SCE) is the ability to use LC balun circuits. In this Short and Sweet article we’ll show how SCE can be put to use in inspecting the behavior of these strange but useful creatures.
What Be These Baluns?
The word “balun” stands for “balanced-to-unbalanced.” It’s a circuit that takes a balanced, differential signal and turns it into a single-ended (grounded) circuit. Baluns also work the other way, from single-ended to differential. It’s the latter that we’re going to show. In our discussion, you’ll see some of the new features of SCE that make analyzing such circuitry easy and intuitive.
Along with converting differential to single and vice versa, a balun can also perform one other important task — impedance matching. An example is shown below, where we wish to take a single-ended 50 Ohm source and match it to a 300 Ohm balanced load. The balun does the work to perform this transformation:

In general, baluns come in both wide band and narrow band configurations. Wide band baluns are usually implemented with coils wrapped around some type of ferrite material. They are cousins to the transformer family. Narrow band baluns can be implemented using a circuit consisting of only lumped Ls and Cs. These are called LC Baluns. We show the details of such a circuit below:
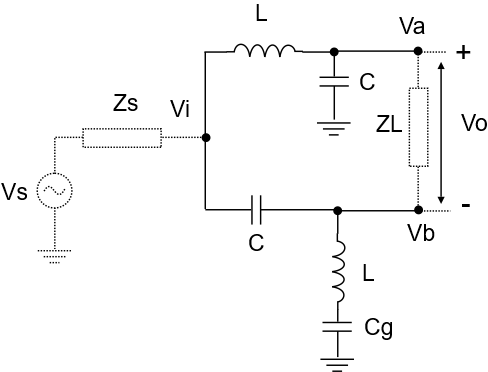
LC Balun single to differential
An LC Balun single-to-differential circuit works by taking a single-ended signal and passing it through two pathways: a second order low-pass filter made from an L and C, and a second order high pass filter, also made from an L and C. (Shown is an optional DC-blocking capacitor, Cg, on the second filter, which can be used for ground isolation. We won’t be using that here. Pretend it’s not there.)
Having no resistive elements, these filters have sharp resonant frequencies. In fact, since they have the same L and C values, they have the same resonant frequency, which can be determined by the following formula:
\(\displaystyle {{f}_{0}}=1/(2\pi \sqrt{{LC}})\)
Because of this resonance, LC baluns are narrow band. They can be used when you have a single frequency you wish to process. They are not appropriate if your signal covers a wide band.
Two filters working in concert
It’s instructive to see what the top and bottom filters of the LC Balun do. Here is a Bode chart (produced by SCE, the production of which is outside the scope of this paper) of the top filter, showing the transfer function from the input voltage Vi, to the output voltage Va:
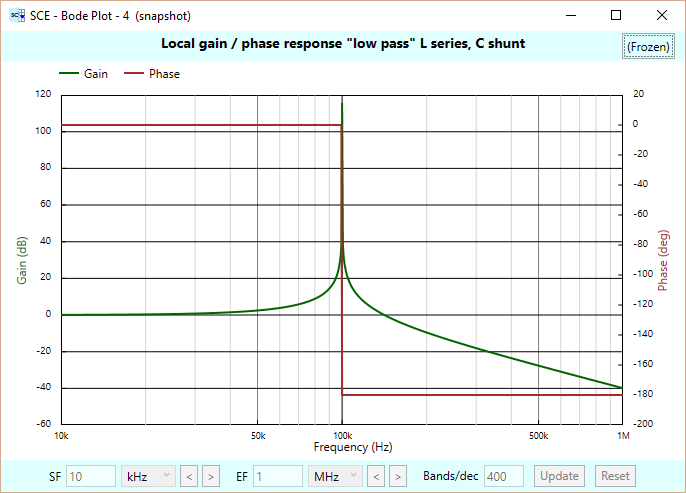
This filter starts out with 0 dB gain, and a phase of 0. At the resonant frequency the gain spikes (theoretically to infinity) and the phase does a rapid transition to -180 degrees. At the spike, the phase will be -90 degrees. After the spike, the gain tapers off, eventually at a -40 dB/decade rate.
Be aware that the spike really doesn’t go to infinity in the real world, due to parasitics in the components (for example, a bit of resistance in the capacitor and inductor.)
The bottom filter works in reverse: as a “high pass” filter, whose response is shown below in the Bode plot of the transfer function from the input voltage Vi to the output voltage Vb:
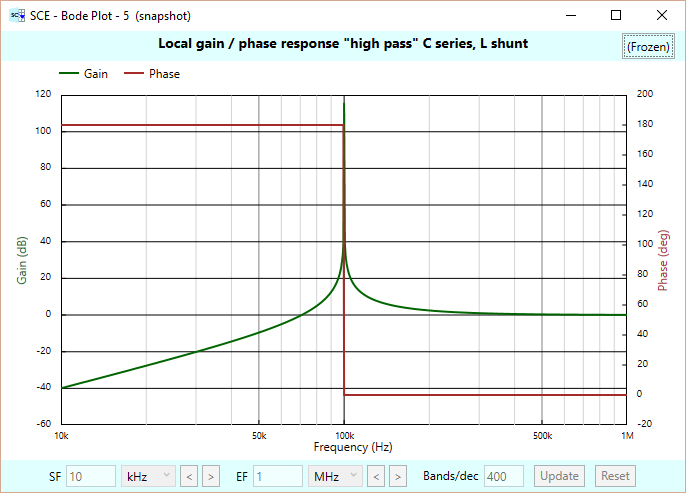
This filter attenuates lower frequencies, the gain going upwards at a 40 dB/decade rate, until rising to spike once again at the resonant frequency. The phase is at a constant 180 degrees until resonance, and once again, we see a rapid transition in phase, this time, from 180 to 0 degrees. Right at resonance, the phase is +90 degrees. After resonance, the gain tapers off and settles to 0 dB. The phase, to 0 degrees.
In the time domain
You can see, then, that the two filters of an LC balun have -90 and +90 degree phase shifts at resonance. Combined, they can form a proper differential signal (Va – Vb). To see this, here is a time-domain plot contrasting the input voltage Vi with the two output voltages Va and Vb. (Disclaimer: This plot was not created with SCE, since it currently only handles values in the frequency domain.)
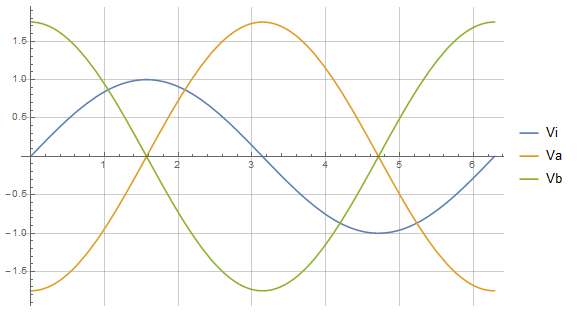
Besides the phase shift on the two output signals, you’ll notice a gain of 1.75 on each signal. We’ll talk about that gain in a bit.
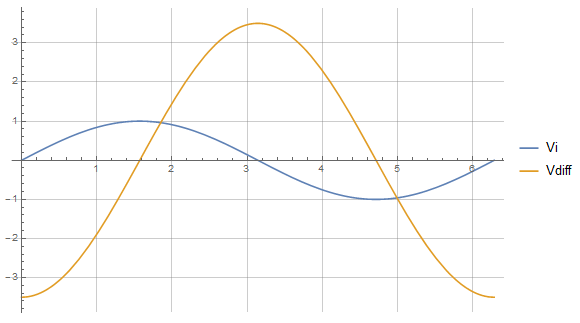
Here’s a another plot contrasting Vi with the differential voltage Vdiff = Va – Vb. Notice we now have a differential gain of 3.5:
Exploring LC Baluns in SCE
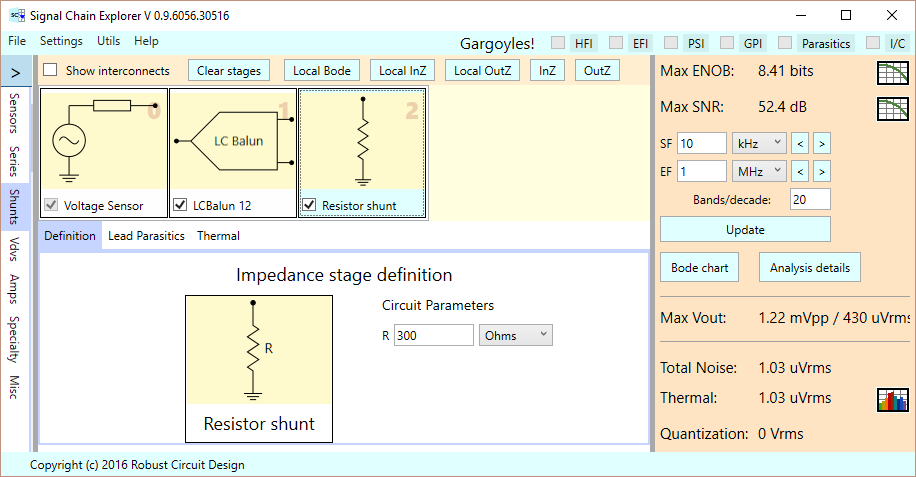
Let’s see how we can implement our balun circuit in SCE. The first thing to do is chop the circuit into a sequence of “stages”. There are three stages here: (1) The sensor stage, (20 the balun stage, and (3) the load stage. Here’s how the signal chain looks in SCE after adding these stages:
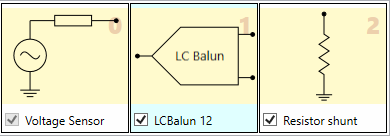
You might wonder about the shunt stage, which we show going to ground. SCE was originally designed to handle only single-ended signals. It currently has no understanding of the differential variety. Since LC Baluns are a brand new addition, we haven’t had time to integrate the notion of differentiality. Not to worry, though. As far as understanding circuit behavior such as gain and impedance, we can pretend the differential signals are single-ended.
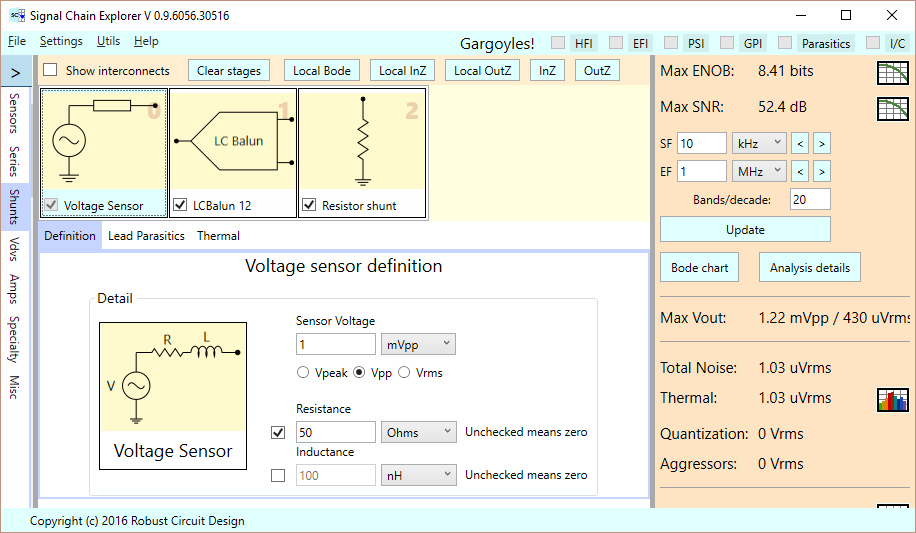
Let’s take a look at these stages in detail. The sensor stage incorporates a voltage source (arbitrarily set to 1 mVpp), with an optional series resistance and inductance. We’re using a resistance of 50 Ohms. That is, our sensor stage is the 50 Ohm source into the balun:
Next, the LC Balun stage:
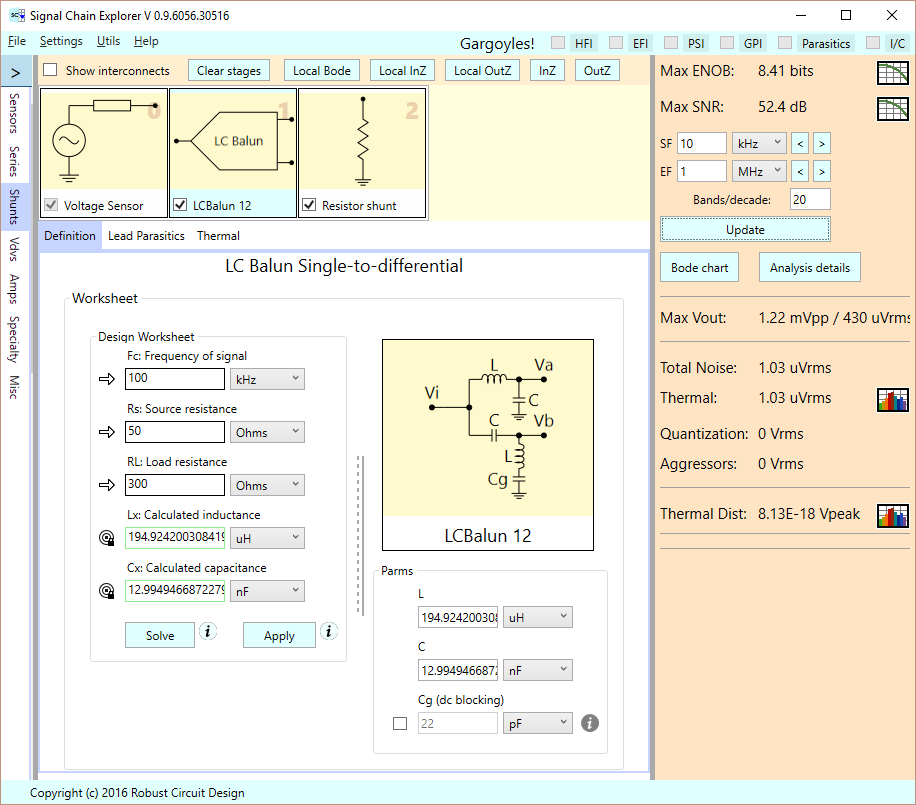
This stage incorporates one of the unique features of SCE: The use of equation worksheets. In this example, we have a worksheet that lets us pick a frequency of interest, the source resistance we’d like to convert, and the load resistance we’d like to convert into. From this, we can solve for the circuit components L and C by first pressing Solve to see the results, and then Apply to apply the component values for real to our balun.
The equations being implemented are as follows:
\(\displaystyle \begin{array}{l}X=\sqrt{{Rs\,RL}}\\\omega =2\pi {{f}_{c}}\\L=X/\omega \\C=1/(X\omega )\end{array}\)
In our example, we’ve designed the balun to work at 100 kHz, with a source resistance of 50 Ohms, and a load resistance of 300 Ohms. The latter is defined by a “shunt” stage (remember our discussion earlier about pretending we have a differential load):
With the stages defined and in place, we can click the Bode chart button in the main results panel to see the overall frequency response of this circuit. We’ve plotted it for a range of frequencies surrounding our target 100 kHz:
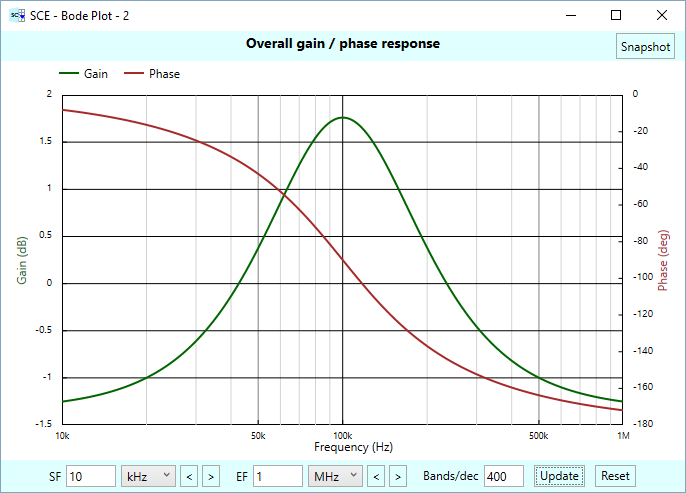
This chart shows that our balun does indeed peak at 100 kHz, and has a gain — that we get “for free” from the LC resonance — of 1.75, the same gain we saw earlier in the first time domain chart for signals Va and Vb. Remember that SCE doesn’t yet understand differential signals, so it doesn’t know how to think in terms of differential gain. For example, our differential signal Vdiff in our earlier time domain chart shows a gain that’s twice what we see here.
Won’t you be my baluntine?
What about the impedance matching we promised earlier? Well, the idea with LC baluns is that they do their best matching at the resonant frequency, and we can see this quite easily with SCE, using the two buttons InZ and OutZ.
Input Impedance
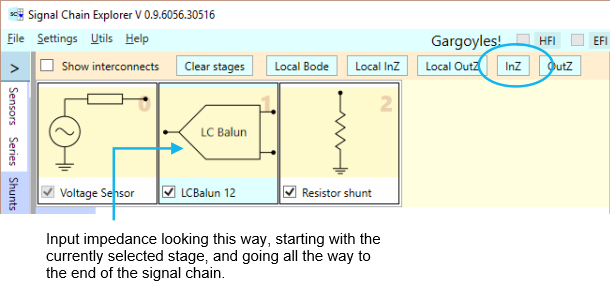
The InZ button gives us an impedance plot showing the input impedance from the currently selected stage, all the way to the end of the chain. Here is a figure showing where the InZ button is located, and how to interpret its behavior:
WARNING: Don’t confuse the InZ button with the Local InZ button. The latter is an entirely different beast that we’ll talk about in later articles. But basically, the Local InZ button looks at the input impedance of the stage as though it were the only stage in the chain.
The result of pressing the non-local InZ button is given the impedance vs frequency plot shown below:
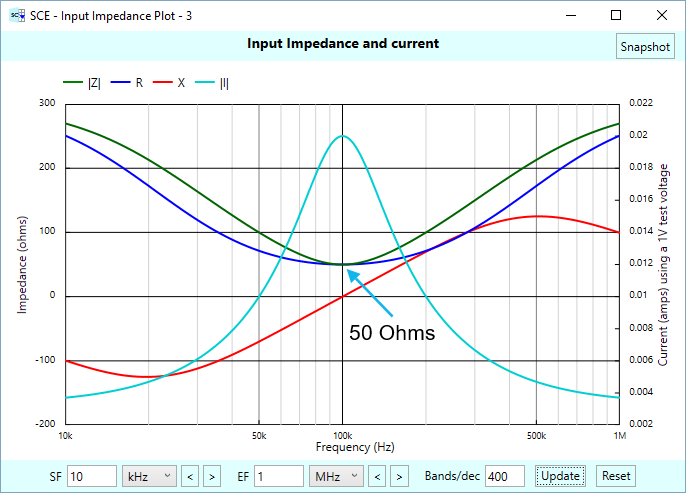
This plot is a useful beast showing four types of data: The magnitude of the complex impedance in green, the real (resistive) portion of the impedance in blue, the imaginary (reactive) portion in red, and finally, the current that results from passing an arbitrary test voltage of 1V through the system, shown in turquoise. We are most interested in the impedance at the resonant frequency of 100 kHz. There, the reactance is zero, so we have a purely resistive impedance, and it’s right at 50 Ohms. Notice at the ends of the graph that the impedance is trucking on its way to 300 Ohms, in both directions. In fact, the impedance will be at this number at DC, and at infinite frequency.
What’s the significance of this chart? Well, our source impedance (from the sensor stage) is 50 Ohms. Our load impedance (in the shunt stage) is 300 Ohms. The balun stage serves to match these impedances by making itself look like 50 Ohms to the sensor stage, even though the balun stage has that 300 Ohm load hanging on it.
This only occurs right at the resonant frequency. Elsewhere, the matching isn’t so good, and gets progressively worse the further away from the center frequency we get. But that’s okay. We’re mainly interested in what goes on at 100 kHz. That’s the nature of using a narrow-band balun.
Output impedance
What about output impedance? The OutZ button gives us an impedance plot showing the output impedance from the currently selected stage, all the way to the beginning of the chain. Here is a figure showing where the OutZ button is located, and how to interpret its behavior:

Here’s the resulting plot:
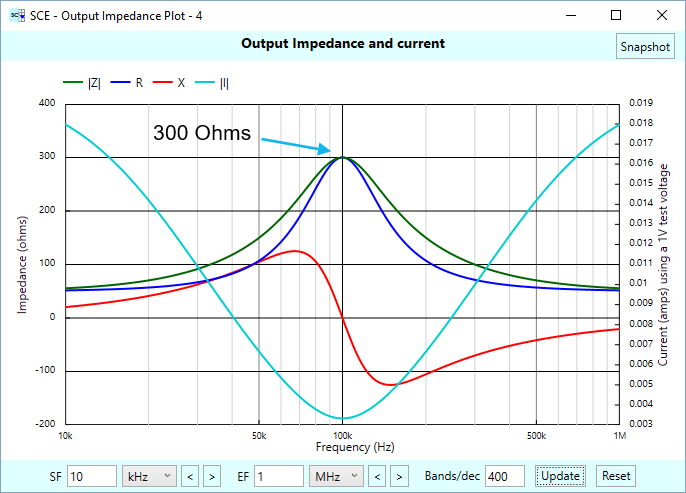
From this plot, we see that the impedance becomes purely resistive at the resonant frequency, and that it’s right at 300 Ohms. That is, to the resistor load stage, the LC balun stage looks like a 300 Ohm source resistance, even though the stage itself has a 50 Ohm source. Once again, this is only true at our resonant frequency of 100 kHz. At the frequency extremes the balun stage looks like 50 Ohms.
Summary
In this Short and Sweet article, we’ve shown you how LC baluns work, and you’ve seen how Signal Chain Explorer can be used to help understand how they operate. In particular, the InZ and OutZ plots are quite handy. You can select a stage at any point in the signal chain and see what’s going on in terms of input and output impedance. That’s especially useful for things like impedance matching baluns, for you can easily verify that your baluns are doing what you desire.
Remember that LC baluns only work for narrow band signals. For wide band impedance matching, baluns made up of various kinds of transformer configurations are used. Do note that although SCE doesn’t currently have such types of baluns implemented, it does now have a basic transformer stage that you can try, which can be used for certain types of balun implementations. This new transformer stage, while basic, can model the parasitics that exist in real-world transformers — parasitics that can trip you up. Be sure to have a look!
Comments
LC Baluns In Action — No Comments
HTML tags allowed in your comment: <a href="" title=""> <abbr title=""> <acronym title=""> <b> <blockquote cite=""> <cite> <code> <del datetime=""> <em> <i> <q cite=""> <s> <strike> <strong>