Required Sensor Power – Part 2
In Part 1 of this Short and Sweet article we introduced the concept of finding the minimum required power a sensor needs to deliver in order to achieve a desired signal quality for a given signal chain — that quality being measured as the signal-to-noise ratio or effective number of bits. Here in Part 2, we’ll see the concept put to use in Signal Chain Explorer.
To recap, in Part 1 we developed the following formulas for computing the minimum required output voltage, input voltage and input power:
\(\displaystyle {{S}_{{vo}}}=SNR\times {{N}_{{vo}}}\)
\(\displaystyle {{S}_{{vi}}}=\frac{{SNR\times {{N}_{{vo}}}}}{{\left| {G(s)} \right|}}\)
\(\displaystyle {{S}_{{pi}}}(s)=\frac{{{{S}_{{vi}}}^{2}}}{{InZ(s)}}\)
where \(\displaystyle {{{N}_{{vo}}}}\) is the noise voltage of the signal chain referred to output, SNR is the desired signal to noise ratio, \(\displaystyle G(s)\) is the signal chain gain, and \(\displaystyle {InZ(s)}\) is the input impedance of the signal chain.
We gave an example of a simple signal chain with an ideal voltage-source as a sensor and a low-pass filter as the conditioning stage:
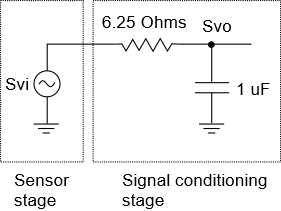
For a frequency of interest (FOI) of 1 KHz, and a desired signal resolution of 24 bits, we solved for the required sensor power, coming up with the following results:
UPDATE: Earlier versions of this post used a 10 kHz FOI. We changed to 1 kHz to be further away from the low pass corner — a more realistic scenario.
\(\displaystyle \left| {G(j\omega )} \right|=\left| {\frac{1}{{1+j\omega RC}}} \right|=\left| {\frac{1}{{1+j6.2832\times {{{10}}^{3}}\times 6.25\times 1\times {{{10}}^{{-6}}}}}} \right|=0.99923\)
\(\displaystyle InZ(j\omega )=R+\frac{1}{{j\omega C}}=6.25+\frac{1}{{j6.2832\times {{{10}}^{3}}\times {{{10}}^{{-6}}}}}=6.25-159.155j\)
\(\displaystyle SNR={{2}^{N}}\sqrt{{{3}/{2}\;}}={{2}^{{24}}}\sqrt{{{3}/{2}\;}}=20,547,809\)
\(\displaystyle {{S}_{{vo}}}=SNR\times {{N}_{{vo}}}=20,547,809\times 63.26\times {{10}^{{-9}}}=1.3\ Vrms\)
\(\displaystyle {{S}_{{vi}}}=\frac{{{{S}_{{vo}}}}}{{\left| {G(j\omega )} \right|}}=\frac{{1.3}}{{0.99923}}=1.301\ Vrms\)
\(\displaystyle {{S}_{{pi}}}(j\omega )=\frac{{{{S}_{{vi}}}^{2}}}{{{{{\left| {G(j\omega )} \right|}}^{2}}}}\times \frac{1}{{InZ(j\omega )}}={{1.301}^{2}}\times \frac{1}{{6.25-159.155j}}=0.000417+0.01062j\)
\(\displaystyle \text{Power factor}=Sgn({Im}(InZ(j\omega )))\times \frac{{\text{Real power}}}{{\text{Apparent power}}}=(-)\frac{{0.00042}}{{0.0106}}=-0.0392\)
Next, we’re going to see these equations come alive in Signal Chain Explorer
The Signal Chain in SCE
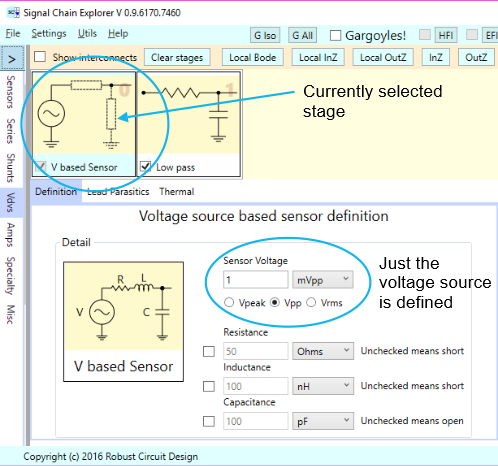
Here’s how the signal chain looks in Signal Chain Explorer, along with the sensor stage definition, which is just a simple, ideal, voltage source, that we’ve setup with the default voltage of 1 mVpp:
While we could have defined our low pass filter right in the sensor stage, we’ve chosen to split it out as a separate stage:
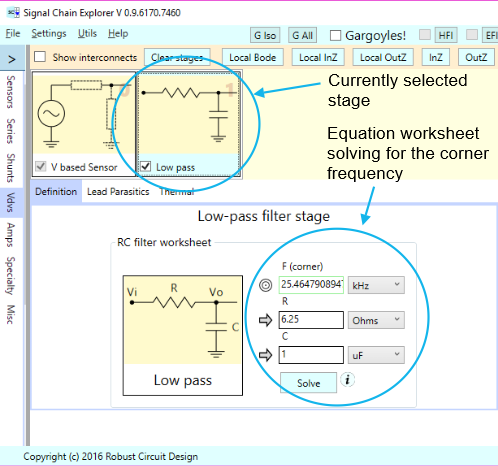
Note how we used the low pass filter equation worksheet to compute the corner frequency for us, (we made that frequency the target, or dependent field), which comes out to 25.465 kHz.
Initial Results
Next, we set the frequency range from 1 mHz to 1 GHz, the frequency of interest to 1 kHz, and then press the Update button on the right side panel of the main screen to see the initial results:
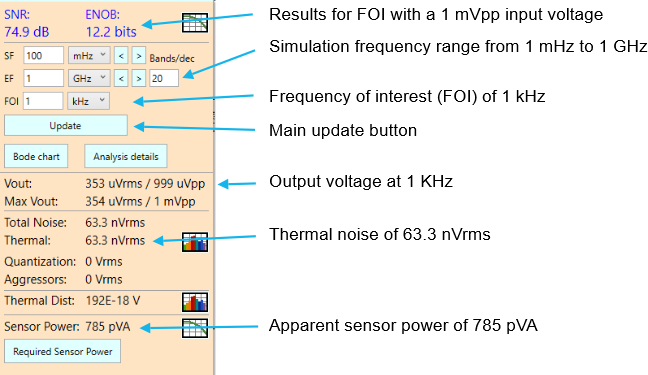
SCE has automatically computed a sensor power of 785 pVA that our current setup requires. In this case, for a 1 mVpp sensor voltage, we happen to achieve a resolution of 12.2 bits.
24-Bit Results
Suppose we want 24 bit resolution instead. We can make that happen by pressing the Required Sensor Power button at the bottom of the panel. This pops up the following dialog where we can specify our desired resolution and compute the necessary sensor values:
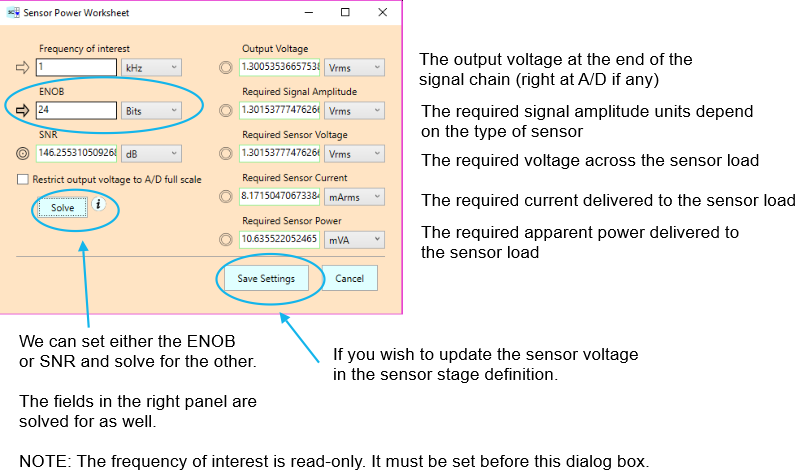
After making ENOB the arrow field (ie., the independent field), we press the Solve button to solve for the corresponding SNR, and the required output voltage, required signal amplitude, sensor voltage, current, and power are solved for us as well. Here, we see that 10.6 mVA of power is what’s required. Note that these calculations are performed for the frequency of interest, set in this case to 1 kHz. You would get different answers for other frequencies, depending on the signal chain response.
NOTE: The “Restrict output voltage” check box is discussed later on. Leave it unchecked for now.
You might wonder why we have the seemingly extraneous Required Signal Amplitude field, along with the Required Sensor Voltage field. This dialog is generalized for any type of sensor, be it voltage-source-based, current-source-based, or charge-source-based. Whatever the basis, the Required Signal Amplitude field shows the required signal amplitude using the appropriate units, be it voltage, current, or charge. (All are RMS values). The other fields are derived from that.
If you’d like to see the results applied to your signal chain, you press the Save Settings button. This updates the signal amplitude in the actual sensor stage and then closes the dialog. If you don’t want the changes, simply press Cancel to close the dialog.
If you choose to save the settings, the Sensor Stage Definition Panel and the Results Panel are automatically updated as shown below:
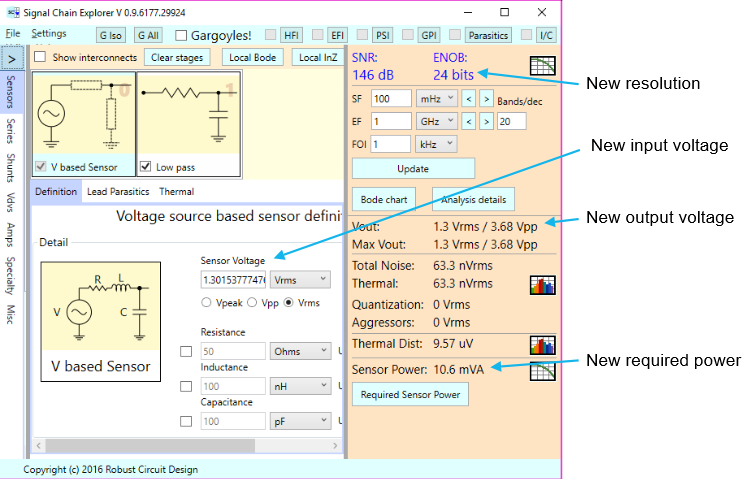
If you compare the new values with what we gave at the beginning of this article, where the computation results from Part 1 were summarized, you’ll see everything is as expected. Also, if you look back at our initial baseline results where we ended up with 12.2 bits of resolution, we had a very tiny power requirement: 785 pVA. Now, for 24 bits, it’s 10.6 mVa. That’s a huge increase of over 10 million times. Yowza! You can see that wanting more resolution can really cost you.
Sensor Power in Detail
The sensor power shown in the results panel of 10.6 mVA is actually the required apparent power. (Hence the VA units instead of Watts). The power is actually a function of frequency, and the result shown is only good for the FOI of 1 kHz. If you press the graph icon to the right of the sensor power field, a chart is shown that plots sensor power vs frequency and gives us more details concerning the makeup of the power:
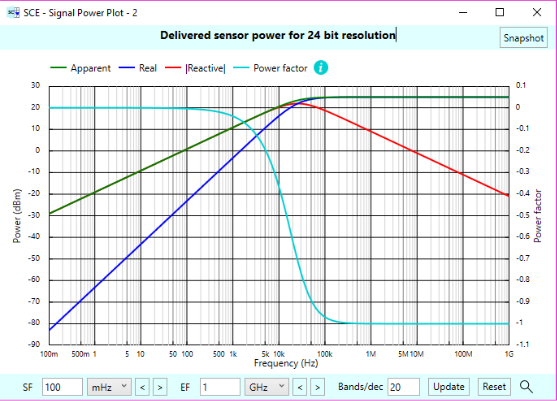
The power chart plots four aspects of the power: (1) the apparent power in green, (2) the real (or “true” or “dissipative” power in blue, (3) the reactive power in red, and (4) the signed power factor in turquoise, where a negative sign means the sensor load is capacitive, and positive if the load is inductive. The power factor axis is on the right. The others share the left axis. The chart is log-linear, but with the Y-axis representing the power in dBm (decibels w.r.t. 1 mW).
NOTE: The green apparent power curve may hide portions of the other curves. You’ll have to either use your imagination, or better yet, you can turn off the curves individually by clicking on the legends, which act like ON/OFF toggles.
We can see from the plot that at low frequencies the real portion of the power is much lower than the reactive portion Why? It’s because the capacitor is determining the current which in turn determines the power flow. With very little real power, the power factor, shown in turquoise, is near 0, but starts going negative. It goes negative because we are delivering the power to a capacitive load. Then as the frequency rises, the required power rises too, till the 20 kHz, range, where the real portion of the power takes over — the capacitor is becoming more like a short, so most of the power is dissipated in the resistor — and the power flattens out to about 25 dBm, with the power factor settling to near minus one. This means we have mostly dissipative, real power, but for what little reactive power is present, it’s delivered to the capacitive load, aka the capacitor in our filter.
If you wish to see exact values at any given frequency, you can click the Inspector Icon located near the bottom right-hand corner:
![]()
Clicking on this icon pops up an inspector window which shows relevant details for the frequency specified, which defaults to the system’s frequency of interest, in this case, 1 kHz. But you can change that to any value you want. (That frequency does not get saved, however.) Here’s the dialog for our example, at 1 kHz:
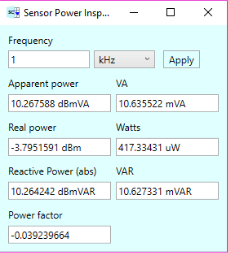
The first three aspects of the power are shown, both logarithmically in dBm, and in straight VA, Watts, or VAR units. The power factor is also given as a straight number between 0 and 1 — with a possible minus sign. Here, it’s negative, indicating a capacitive load at our given frequency of 1 kHz. We can see that the load is capacitive by inspecting the input impedance of the signal chain, which serves as our sensor load. To see a chart of this impedance, select the sensor stage and then press the InZ button:
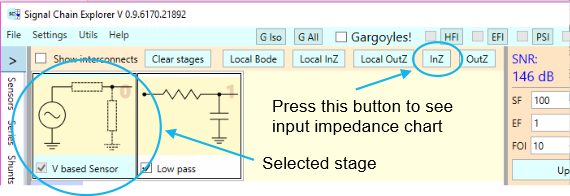
NOTE: See this article for a discussion on input and output impedances and how to view them in Signal Chain Explorer.
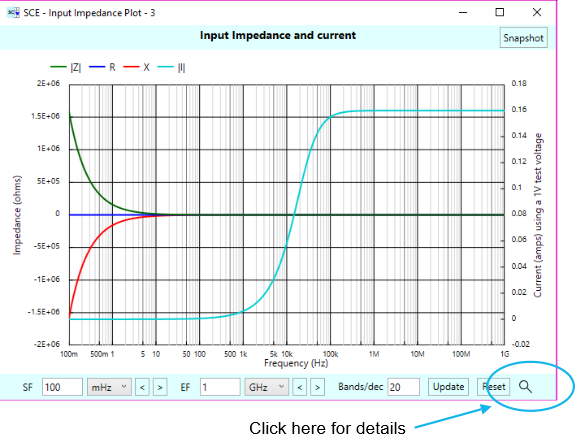
This chart has its own Inspector Icon, (at the bottom-right corner), so click on that to see the impedance at the frequency of interest (1 kHz):
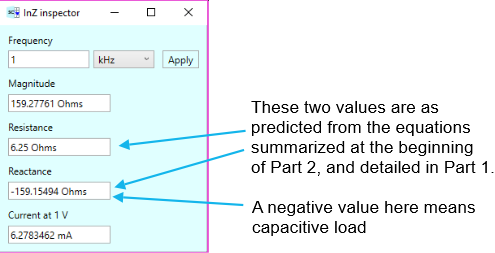
The values are as predicted at the beginning of this article, and the negative imaginary part means we have a capacitive load. (We hope so! There are no inductors in sight in our low pass filter.)
Using the full scale output voltage check box
In our example so far, the output voltage was 3.68 Vpp. If we had an A/D converter that was 5 Vpp full scale, we wouldn’t be using all of the range. It’s interesting to see what would happen if we did use all that range. There’s a check box in the Required Sensor Power dialog that we can check to cause this to take place. Here’s an example:
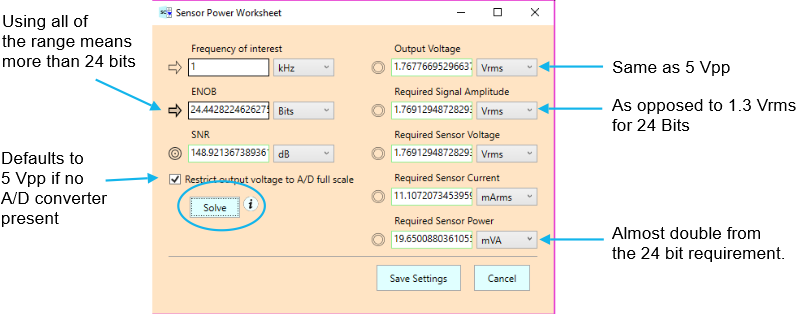
Because we don’t really have an A/D converter in our signal chain, the dialog defaults full scale output to be 5 Vpp, which turns into 1.77 Vrms. With this required output voltage, the resulting SNR can be back-computed as follows:
\(\displaystyle SNR=\frac{{{{S}_{{vo}}}}}{{{{N}_{{vo}}}}}\)
and the corresponding ENOB computed from that. The biggest thing of interest is that we now have 24.4 effective bits instead of 24 bits, due to the increase in signal voltage, but the required sensor power of 19.7 mVA is almost double what it was for the 24 bit case (10.6 mVA). Wow!
Why the significant increase? The required sensor voltage went from 1.3 Vrms for the 24-bit case to 1.77 Vrms for the 24.4 bit case, and the sensor power goes up with the square of the sensor voltage. The ratio of increase in our case here is roughly:
\(\displaystyle Increase=\frac{{{{{1.77}}^{2}}}}{{{{{1.3}}^{2}}}}=1.85\)
We see then, that even a slight increase in this range of high resolution has major consequences.
Further Exploration
You’ve now seen how Signal Chain Explorer makes the required sensor power formulas come alive, and in the last section, you saw the first example of what consequences these calculations can bring to light. In Part 3 of this series we’ll do further explorations along these lines.
Comments
Required Sensor Power – Part 2 — No Comments
HTML tags allowed in your comment: <a href="" title=""> <abbr title=""> <acronym title=""> <b> <blockquote cite=""> <cite> <code> <del datetime=""> <em> <i> <q cite=""> <s> <strike> <strong>